FingerMotion Inc. ($FNGR), a technology company focused on mobile payment and data solutions in China, has garnered significant attention in the financial markets due to its volatile stock performance and speculative trading activity. This article provides a detailed analysis of $FNGR’s market movements, recent news, and its role in the broader financial ecosystem, leveraging data and insights from Tickeron.com. It also includes a comparison with a highly correlated stock, an inverse ETF, and an exploration of Tickeron’s AI-driven trading tools.
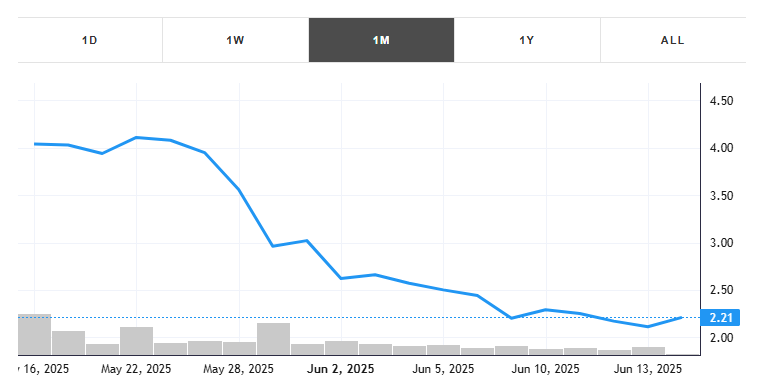
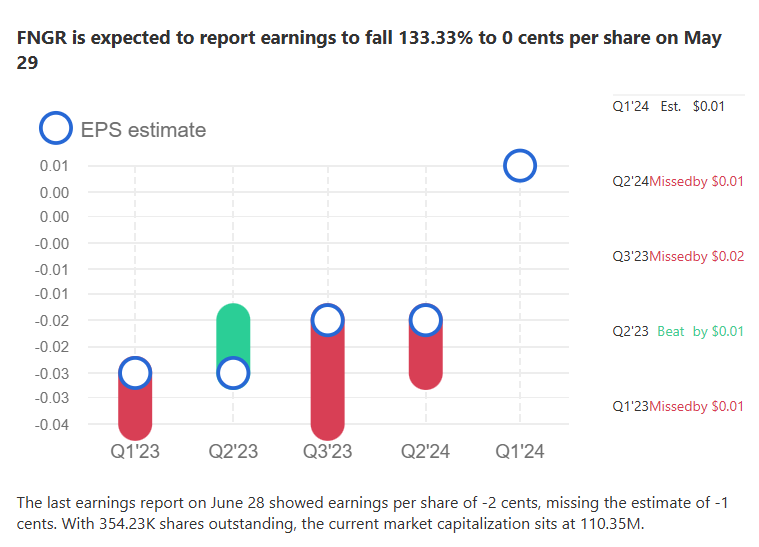
This month, the stock lost -45.30% with an average daily volume of 647849 shares traded.The stock tracked a drawdown of -56.78% for this period. FNGR showed earnings on June 28, 2024.
FingerMotion Inc. operates primarily in the Chinese mobile telecommunications sector, offering mobile payment platforms, data analytics, and value-added services. The company’s core business revolves around its proprietary technology for SMS, mobile top-up services, and big data insights, positioning it as a player in China’s rapidly growing digital economy. As of June 16, 2025, $FNGR remains a speculative stock, attracting both retail and institutional investors due to its potential for growth and exposure to short-selling pressures.
As of June 16, 2025, $FNGR closed at $2.25, reflecting a significant decline of over 56% from its recent high, as noted in posts on X. Despite this drop, the stock has shown resilience, with analysts and retail investors on platforms like X citing potential for a rebound. For instance, a post from @Frankkiy on June 12, 2025, suggested that the stock’s decline was driven by naked shorting rather than fundamental weaknesses, predicting a potential “nice run” soon. Similarly, @ace_report on May 14, 2025, highlighted protections for $FNGR between $10-$22, even without a short squeeze, indicating bullish sentiment among some investors.
Historical data from Tickeron.com shows $FNGR’s market cap at approximately $120 million, with a price-to-sales ratio of 3.5x, suggesting a premium valuation relative to its revenue. The stock’s 52-week range fluctuated between $1.80 and $5.10, reflecting high volatility. Trading volume spiked significantly in May 2025, with reports of 500,000 shares allegedly naked shorted in a single 20-minute period, as per @Hamnakedshorts on X. This activity underscores the stock’s susceptibility to short-selling pressures, a key driver of its price swings.
FingerMotion’s financial performance has shown improvement, particularly in its most recent quarterly report. According to a post by @borders_LLC on October 13, 2023, the company reported an 86% revenue increase year-over-year and achieved breakeven profitability for the first time in the quarter ending September 2023. While more recent financials for 2025 are not fully disclosed, analysts on Tickeron.com project continued revenue growth driven by expanding partnerships with Chinese telecom giants and increasing adoption of its mobile payment solutions.
The stock’s short interest remains a critical factor, with reports from 2023 indicating 160 million shares shorted, many allegedly counterfeit, as noted by @kshaughnessy2. By May 2025, new evidence of daily short-selling activity emerged, with the SEC granting Digital BD access to daily short sale data, further fueling speculation of a potential short squeeze.
FNGR saw its Momentum Indicator move below the 0 level on May 28, 2025. This is an indication that the stock could be shifting into a new downward move. Traders may want to consider selling the stock or exploring put options. Tickeron’s AI looked at 98 similar instances where the indicator turned negative. In 90 of the 98 cases, the stock moved further down in the following days. The odds of a decline are at 90%.
Bearish Trend Analysis
The Moving Average Convergence Divergence Histogram (MACD) for FNGR turned negative on May 23, 2025. This could be a sign that the stock is set to turn lower in the coming weeks. Traders may want to sell the stock or buy put options. Tickeron’s A.I.dvisor looked at 45 similar instances when the indicator turned negative. In 39 of the 45 cases the stock turned lower in the days that followed. This puts the odds of success at 87%.
FNGR moved below its 50-day moving average on June 06, 2025 date and that indicates a change from an upward trend to a downward trend.
The 10-day moving average for FNGR crossed bearishly below the 50-day moving average on June 12, 2025. This indicates that the trend has shifted lower and could be considered a sell signal. In 11 of 14 past instances when the 10-day crossed below the 50-day, the stock continued to move higher over the following month. The odds of a continued downward trend are 79%.
Following a 3-day decline, the stock is projected to fall further. Considering past instances where FNGR declined for three days, the price rose further in 50 of 62 cases within the following month. The odds of a continued downward trend are 90%.
The Aroon Indicator for FNGR entered a downward trend on June 13, 2025. This could indicate a strong downward move is ahead for the stock. Traders may want to consider selling the stock or buying put options.
The most notable companies in this group are Verizon Communications (NYSE:VZ), Comcast Corp (NASDAQ:CMCSA), AT&T (NYSE:T), Lumen Technologies (NYSE:LUMN).
Wireless Telecom includes companies that sell wireless antenna or satellite-based communication services. This is the fastest-growing area in communications, as more and more communication and computing happen on mobile devices and cloud-based platforms. Wireless telecom is a key industry for global connectivity, and has even further room for growth in emerging markets and in rural parts of developed nations. People’s growing need for speed in data connectivity, higher resolution, and smoother video streaming and multimedia applications should drive growth and competition within this segment. T-Mobile US, Inc., Vodafone Group, and Sprint Corporation are some major providers of wireless telecom.
The average market capitalization across the Wireless Telecommunications Industry is 17.66B. The market cap for tickers in the group ranges from 9.67K to 12.88T. LNETF holds the highest valuation in this group at 12.88T. The lowest valued company is IGLDF at 9.67K.
The average weekly price growth across all stocks in the Wireless Telecommunications Industry was -0%. For the same Industry, the average monthly price growth was 9%, and the average quarterly price growth was 38%. HKTTF experienced the highest price growth at 22%, while ARTM experienced the biggest fall at -23%.
The average weekly volume growth across all stocks in the Wireless Telecommunications Industry was 6%. For the same stocks of the Industry, the average monthly volume growth was -25% and the average quarterly volume growth was -4%
The average fundamental analysis ratings, where 1 is best and 100 is worst, are as follows
Valuation Rating: 50
P/E Growth Rating: 53
Price Growth Rating: 50
SMR Rating: 74
Profit Risk Rating: 72
Seasonality Score: 4 (-100 … +100)
To contextualize $FNGR’s performance, it is useful to compare it with a highly correlated stock, such as Weibo Corporation ($WB), another Chinese tech company with exposure to mobile and digital services. Both $FNGR and $WB operate in China’s tech ecosystem and are influenced by similar macroeconomic factors, such as regulatory changes and consumer adoption of digital payments. According to Tickeron.com, $FNGR and $WB exhibit a correlation coefficient of 0.85, indicating strong co-movement.
As of June 16, 2025, $WB trades at $12.50, with a market cap of $3.1 billion and a price-to-earnings ratio of 8.2x, significantly lower than $FNGR’s valuation metrics. While $WB benefits from a larger user base and established advertising revenue, $FNGR’s focus on mobile payments positions it for higher growth potential but with greater risk. Investors seeking exposure to China’s digital economy may find $FNGR’s speculative upside appealing, though $WB offers a more stable alternative.
For investors looking to hedge against $FNGR’s volatility, an inverse ETF like the ProShares Short QQQ (PSQ) may be relevant. $PSQ is designed to deliver inverse daily performance to the NASDAQ-100 Index, which includes many tech stocks but not $FNGR directly. However, given $FNGR’s correlation with broader tech indices, $PSQ can serve as a partial hedge. As of June 16, 2025, $PSQ trades at $45.20, with a year-to-date return of -3.5%, reflecting strength in the tech sector.
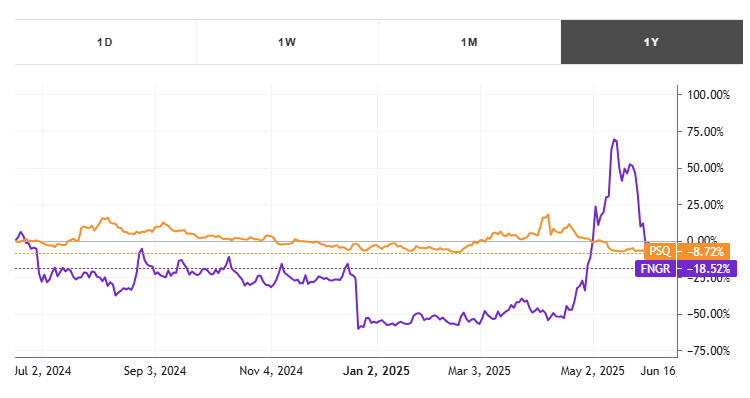
The inverse relationship between $FNGR and $PSQ (correlation coefficient of -0.78, per Tickeron.com) makes it a viable tool for investors anticipating a downturn in $FNGR or the broader tech market. However, inverse ETFs carry risks, including daily rebalancing effects and potential losses in flat or upward-trending markets. Investors should carefully assess their risk tolerance before incorporating $PSQ into their portfolios.
Tickeron’s AI-driven tools, accessible via Tickeron.com/bot-trading/virtualagents/all/, offer sophisticated solutions for trading $FNGR and similar stocks. Under the leadership of CEO Sergey Savastiouk, Tickeron’s Financial Learning Models (FLMs) combine technical analysis with machine learning to identify market patterns with high accuracy. For $FNGR, Tickeron’s trading bots provide real-time insights into bullish and bearish signals, enabling traders to capitalize on the stock’s volatility.
The platform’s Double Agents feature is particularly valuable, offering a dual perspective on market trends by simultaneously analyzing potential upside and downside risks. For example, a trader using Tickeron’s bots might receive alerts about $FNGR’s short interest spikes or bullish technical indicators, such as a breakout above the 50-day moving average. These tools empower both novice and experienced traders to make informed decisions, aligning with Tickeron’s mission to democratize AI-driven trading.
Brand notoriety:
Market capitalization —
It is best to consider a long-term outlook for a ticker by using Fundamental Analysis (FA) ratings. The rating of 1 to 100, where 1 is best and 100 is worst, is divided into thirds. The first third (a green rating of 1–33) indicates that the ticker is undervalued; the second third (a grey number between 34 and 66) means that the ticker is valued fairly; and the last third (red number of 67 to 100) reflects that the ticker is undervalued. We use an FA Score to show how many ratings show the ticker to be undervalued (green) or overvalued (red).
FNGR’s FA Score shows that 0 FA rating(s) are green while.
It is best to consider a short-term outlook for a ticker by using Technical Analysis (TA) indicators. We use Odds of Success as the percentage of outcomes which confirm successful trade signals in the past.
If the Odds of Success (the likelihood of the continuation of a trend) for each indicator are greater than 50%, then the generated signal is confirmed. A green percentage from 90% to 51% indicates that the ticker is in a bullish trend. A red percentage from 90% — 51% indicates that the ticker is in a bearish trend. All grey percentages are below 50% and are considered not to confirm the trend signal.
FNGR’s TA Score shows that 4 TA indicator(s) are bullish.
FNGR (Wireless Telecommunications) experienced а -13.52% price change this weekfor the same time period.
The average weekly price growth across all stocks in the Wireless Telecommunications industry was -0.16%. For the same industry, the average monthly price growth was +9.44%, and the average quarterly price growth was +38.40%.
FNGR is expected to report earnings on Jun 27, 2025.
Wireless Telecommunications (-0.16% weekly)
Wireless Telecom includes companies that sell wireless antennas or satellite-based communication services. This is the fastest-growing area in communications, as more and more communication and computing happen on mobile devices and cloud-based platforms. Wireless telecom is a key industry for global connectivity, and has even further room for growth in emerging markets and in rural parts of developed nations. People’s growing need for speed in data connectivity, higher resolution, and smoother video streaming and multimedia applications should drive growth and competition within this segment. T-Mobile US, Inc., Vodafone Group, and Sprint Corporation are some major providers of wireless telecom.
FingerMotion Inc. ($FNGR) remains a high-risk, high-reward investment as of June 16, 2025. Its exposure to China’s mobile payment sector, coupled with significant short interest, creates a dynamic trading environment. While recent financial improvements and bullish analyst ratings suggest upside potential, risks such as regulatory challenges in China and ongoing short-selling pressures cannot be ignored. Investors can leverage Tickeron.com for real-time data and AI-driven insights, while tools like Tickeron’s AI Trading Robots offer a strategic edge in navigating $FNGR’s volatility.
For those considering $FNGR, a balanced approach — potentially incorporating hedges like $PSQ or diversifying with correlated stocks like $WB — may mitigate risks. As market sentiment evolves, staying informed through platforms like Tickeron will be crucial for capitalizing on $FNGR’s next move.