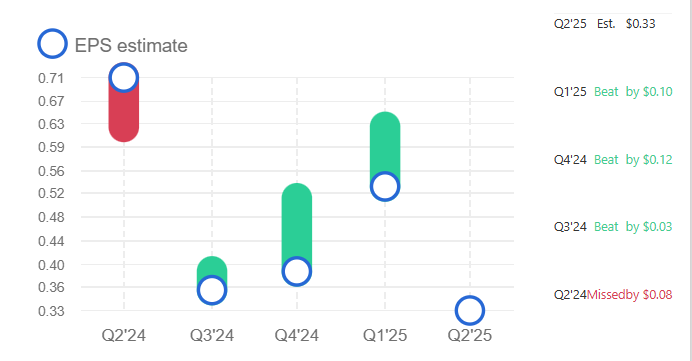
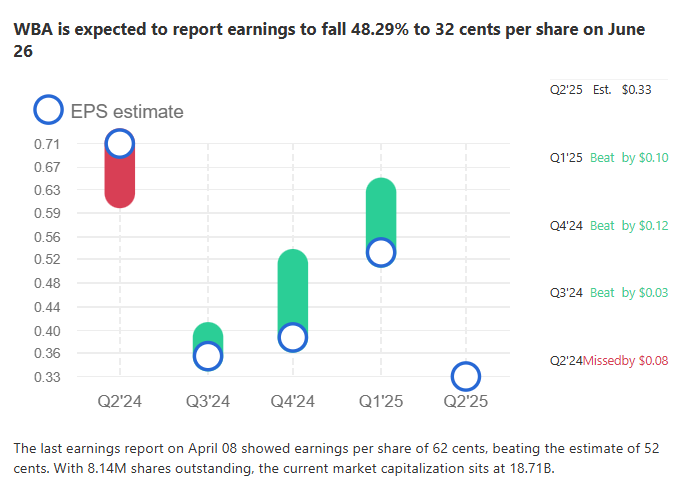
Walgreens Boots Alliance (WBA) is set to release its Q3 FY25 earnings on June 26, 2025, with analysts projecting a significant decline of 48.29% in earnings per share (EPS) to 32 cents. This anticipated drop, coupled with ongoing market volatility and a potential buyout, has placed WBA under intense scrutiny. This article delves into the financial outlook for WBA, examines key market movements as of June 25, 2025, and explores AI-driven trading strategies leveraging tools from Tickeron.com. Additionally, it includes a comparison with a correlated stock and insights into trading WBA alongside an inverse ETF.
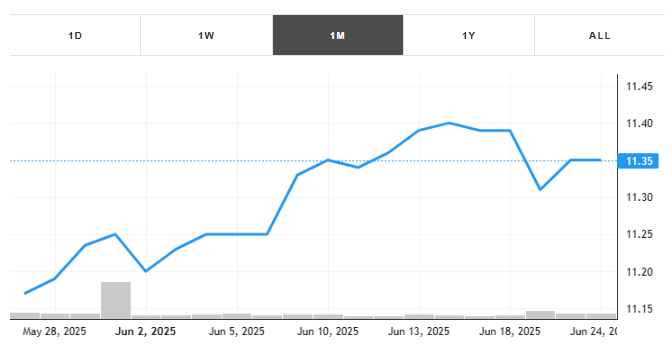
This month, the stock gained +1.61% with an average daily volume of 10 million shares traded. The stock tracked a drawdown of -1.32% for this period. WBA showed earnings on April 08, 2025. You can read more about the earnings report here.
View to see Real Time Patterns for WBA
Analysts forecast WBA’s EPS to fall to 32 cents for Q3 FY25, down from 67 cents in the prior year’s quarter, marking a 48.29% decline. Revenue expectations are also subdued, with estimates pegged at $35.8 billion, a marginal increase of 1.2% year-over-year. This outlook follows a challenging period for WBA, which saw a 25% stock price crash in June 2024 after cutting its profit guidance due to a “challenging consumer environment,” as noted by CEO Tim Wentworth. The company’s decision to forgo a conference call for this earnings release, amid talks of a potential buyout by Sycamore Partners, adds further uncertainty.
WBA’s stock closed at $11.31 on June 24, 2025, up 0.5%. However, its year-to-date performance remains lackluster, with a market capitalization of approximately $9.75 billion and a price-to-earnings (P/E) ratio of 8.2, significantly below the S&P 500’s 24.8. The company’s high debt-to-equity ratio of 0.62 and ongoing store closures (over 2,000 unprofitable locations targeted) signal operational challenges, though asset sales may bolster liquidity.
As of June 25, 2025, financial markets are grappling with heightened volatility driven by U.S.-China tariff tensions and anticipation of corporate earnings. Tech stocks, including top S&P 500 holdings like Apple (AAPL) and Nvidia (NVDA), have retreated, with the Nasdaq 100 futures down 0.54% on June 12. Safe-haven assets like gold and the Japanese yen have surged, reflecting investor caution. The SPDR S&P 500 ETF Trust (SPY) saw its Momentum Indicator turn bullish on April 25, 2025, with a 90% historical success rate, but its Moving Average Convergence Divergence (MACD) turned negative on May 28, signaling potential downside.
Energy stocks, such as Exxon Mobil (XOM), gained traction with oil prices stabilizing at $75 per barrel. Meanwhile, the financial sector faces pressure from the Bank of England’s expected pause on rate cuts at 4.25%, following weak UK GDP data. These dynamics suggest a cautious market backdrop for WBA’s earnings, with investors eyeing macroeconomic trends and corporate restructuring.
Tickeron.com offers cutting-edge AI-powered tools, including its Financial Learning Models (FLMs) and AI Trading Robots, to navigate volatile stocks like WBA. Under CEO Sergey Savastiouk, Tickeron’s Virtual Trading Agents integrate technical and fundamental analysis to identify bullish and bearish signals. For WBA, these bots analyze metrics like Relative Strength Index (RSI), volume profiles, and earnings sentiment to optimize trade execution.
On June 17, 2025, Tickeron’s upgraded FLMs achieved annualized returns of 250% to 362% for select trading agents, showcasing their precision in high-liquidity environments. For retail investors trading WBA, Tickeron’s Double Agent bots provide a dual perspective, balancing long and short positions to mitigate risk amid the stock’s 5.94% drawdown this month. These tools empower traders to capitalize on WBA’s price swings while managing downside exposure.
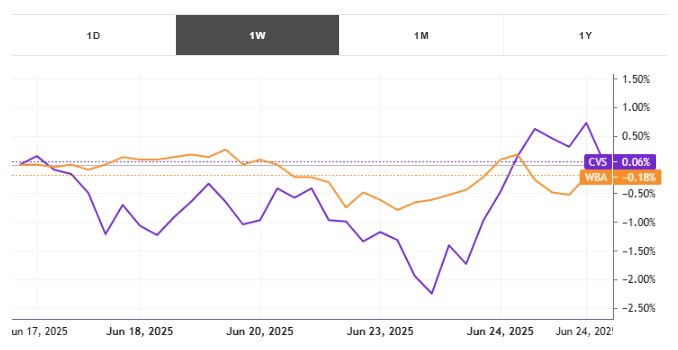
WBA exhibits a high correlation with CVS Health (CVS), another pharmacy retail giant, with a correlation coefficient of 0.85 over the past year. Both stocks face similar headwinds, including reimbursement pressures and rising operational costs. However, CVS reported a stronger Q1 2025 EPS of $1.31, beating estimates by 2 cents, with revenue of $88.4 billion, up 3.7% year-over-year. CVS’s stock gained 4.8% year-to-date, outperforming WBA’s -12.3%. While CVS’s forward P/E of 9.1 is slightly higher than WBA’s, its diversified healthcare services, including Aetna, provide a buffer against retail pharmacy challenges. Traders may consider CVS as a comparative benchmark when assessing WBA’s post-earnings trajectory.
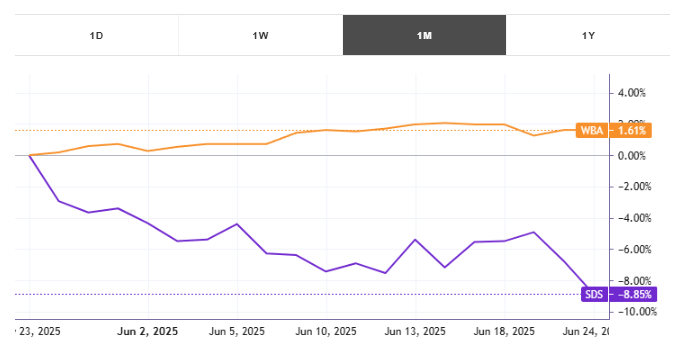
Pairing WBA with an inverse ETF, such as the ProShares UltraShort S&P 500 (SDS), which has a near-perfect negative correlation (-0.95) with the S&P 500, offers a compelling hedging strategy. When WBA underperforms amid broader market declines, SDS gains value, offsetting losses. Tickeron’s AI Trading Robots can automate this pair trade, using VIX signals (e.g., spikes above 25) to trigger inverse ETF entries. This approach minimizes downside risk while allowing traders to capitalize on WBA’s potential recovery post-earnings, especially if buyout talks escalate.
WBA’s anticipated 48.29% EPS decline on June 26, 2025, reflects broader challenges in the pharmacy retail sector, compounded by a potential buyout and market volatility. However, strategic store closures and asset sales could pave the way for a leaner operation, supporting a higher buyout premium. By leveraging Tickeron.com’s AI-driven tools, traders can navigate WBA’s price movements with precision, using FLMs and Double Agent bots to balance risk and reward. As markets remain volatile, WBA presents both challenges and opportunities for astute investors.