
A Look at JPM, WFC, BLK, C, BK, and FULT's Q2 2025 Earnings Preview and How Tickeron's AI Trading Bots Provide Profitable Strategies Despite Volatility
As the Q3 calendar unfolds, investors are turning their attention to the official kickoff of Q2 2025 earnings season this week (July 14-18, 2025). Major financial institutions are set to report, providing critical snapshots of economic health, interest rate impacts, and sector resilience. Tuesday, July 15, stands out with a lineup of powerhouse banks and asset managers unveiling their results. From net interest income trends to asset under management growth, these reports could spark market movements, especially in a landscape shaped by lingering inflation concerns and geopolitical uncertainties.
In this earnings preview, we'll highlight key expectations and recent developments for the companies reporting on July 15: JPMorgan Chase & Co. (JPM), Wells Fargo & Co. (WFC), BlackRock (BLK), Citigroup (C), Bank of New York Mellon (BK), and Fulton Financial (FULT). Drawing from analyst projections and recent news, we'll outline what to watch—such as revenue growth, expense controls, and balance sheet strength. But beyond the previews, we'll explore how sophisticated AI-driven tools can turn earnings volatility into opportunity. At Tickeron, our proprietary AI Trading Bots—powered by advanced Financial Learning Models (FLMs)—have demonstrated consistent performance in trading these very tickers, offering retail and institutional investors an edge without the constant manual oversight.
Earnings Preview: What to Expect from July 15 Reports
The financial sector has navigated a mixed environment in Q2 2025, with steady deposit growth offset by moderating loan demand and persistent regulatory scrutiny. Analysts anticipate modest year-over-year improvements in earnings per share (EPS) for most, driven by fee income and capital markets activity, though net interest income (NII) pressures from potential rate cuts loom. Here's a concise look at each company:
- JPMorgan Chase & Co. (JPM): As the largest U.S. bank by assets, JPM is expected to report EPS of $4.51, up 2.5% from last year, with revenues climbing 8% to approximately $45.3 billion. Recent highlights include a reaffirmed 2025 NII outlook of $90 billion (excluding markets), bolstered by robust trading and investment banking fees amid market volatility. Investors should watch for updates on consumer spending trends and credit loss provisions, as these could signal broader economic resilience. JPM's stock has rallied in recent months, but earnings could test that momentum if trading revenues fall short.
- Wells Fargo & Co. (WFC): WFC is projected to deliver EPS of $1.40-$1.41, reflecting disciplined expense management and a 1%-3% NII increase year-over-year, with revenues around $20.8 billion. The bank has focused on rebuilding its consumer banking franchise post-regulatory challenges, with recent news emphasizing growth in wealth management and commercial lending. Key metrics to monitor include deposit costs and mortgage origination volumes, which could highlight sensitivity to interest rates. A beat on NII could reinforce WFC's recovery narrative.
- BlackRock (BLK): The world's largest asset manager is forecasted to post EPS of $10.77, a 4% rise, fueled by record assets under management (AUM) and strong ETF inflows. BLK's Q1 2025 results exceeded expectations with fee revenue growth, and Q2 should benefit from fixed income and alternative investments amid investor diversification. Watch for commentary on private markets expansion and tech integrations, as these drive long-term AUM growth. With AUM surpassing $10 trillion recently, BLK remains a bellwether for global investment flows.
- Citigroup (C): C's ongoing strategic overhaul positions it for EPS of $1.63 (up from $1.57 YoY) and revenues of $20.93 billion, a 4.4% increase. Recent developments include aggressive cost-cutting and share buybacks, with focus on wealth management and services segments. Earnings could spotlight fixed income trading gains and international operations, but regulatory capital requirements remain a risk. A strong report might accelerate C's stock rebound.
- Bank of New York Mellon (BK): BK is anticipated to report EPS around $1.75, supported by NII growth and fee income from securities services. As of March 31, 2025, the custodian bank managed $2.0 trillion in AUM and $53.1 trillion in assets under custody/administration. Recent emphasis on FX gains and asset servicing efficiency could offset expense pressures. Investors should eye updates on digital asset initiatives, which position BK for future growth in a tokenized economy.
- Fulton Financial (FULT): The regional bank is expected to announce EPS of $0.43-$0.45, with revenues dipping 5% to $318 million, reflecting rate volatility impacts. FULT's FY2025 NII guidance of $995 million to $1.02 billion assumes stable margins, bolstered by recent deposit growth and commercial banking expansions. Key focus areas include loan portfolio quality and dividend sustainability, making this a gauge for mid-tier bank health.
These reports matter because they offer insights into credit trends, consumer confidence, and capital markets vitality—factors that could influence Fed policy and broader indices. Yet, earnings surprises often trigger sharp price swings, leaving manual traders scrambling. This is where AI steps in, automating decisions with data-driven precision.
Navigating Earnings Volatility with Tickeron's AI Trading Bots
Earnings seasons like this one amplify opportunities—and risks—for stock traders. Instead of poring over charts and news feeds, savvy investors are turning to AI-powered solutions that analyze vast datasets in real-time. At Tickeron, our AI Trading Bots leverage proprietary Financial Learning Models (FLMs)—advanced algorithms akin to large language models but tailored for finance—to process price action, volume, news sentiment, and macroeconomic indicators. These bots generate precise buy/sell signals, backtested for reliability, allowing users to capitalize on post-earnings moves without emotional bias.
A recent breakthrough enhances this edge: Tickeron's launch of next-generation AI Trading Agents with ultra-fast 15-minute and 5-minute ML time frames, announced on June 23, 2025. This upgrade, born from scaled AI infrastructure, enables more frequent data processing and adaptive responses to intraday shifts—far surpassing the industry-standard 60-minute intervals. Early tests show improved trade timing and accuracy in volatile conditions, democratizing institutional-grade tools for all investors. As Sergey Savastiouk, Ph.D., CEO of Tickeron, noted, "Our 15- and 5-minute ML cycles deliver unprecedented precision, empowering traders with tools previously exclusive to institutional investors."
For the tickers reporting on July 15, two standout bots from our suite have proven track records in trading these stocks: the Trend Trader: Popular Stocks, 60 min, (TA&FA) – Signal Agent and the Swing Trader: High Volatility Stocks for Active Trading, 60 min, (TA&FA) – Virtual Agent. These agents integrate technical analysis (TA) and fundamental analysis (FA) via neural networks, focusing on trend reversals and momentum while managing risk intelligently. Let's dive into their strategies, performance, and why they're ideal for earnings-driven plays.
Trend Trader: Popular Stocks, 60 min, (TA&FA) – Signal Agent
This bot targets highly liquid, popular stocks like (JPM), (WFC), and (C), using a proprietary quant method to evaluate multi-timeframe trends and enter positions only when alignments are clear. It's perfect for active traders handling 40-50 positions, with an average trade duration of 3 days—short enough to capture earnings reactions without prolonged exposure.
Key features include:
- Entry Logic: Neural network-processed technical indicators identify optimal reversal points in trending markets.
- Risk Management: Fixed 6% take-profit and 3% stop-loss, plus a trailing stop to lock in gains during reversals.
- Diversification: Medium-high universe score, with up to 54 open positions to spread risk across sectors.
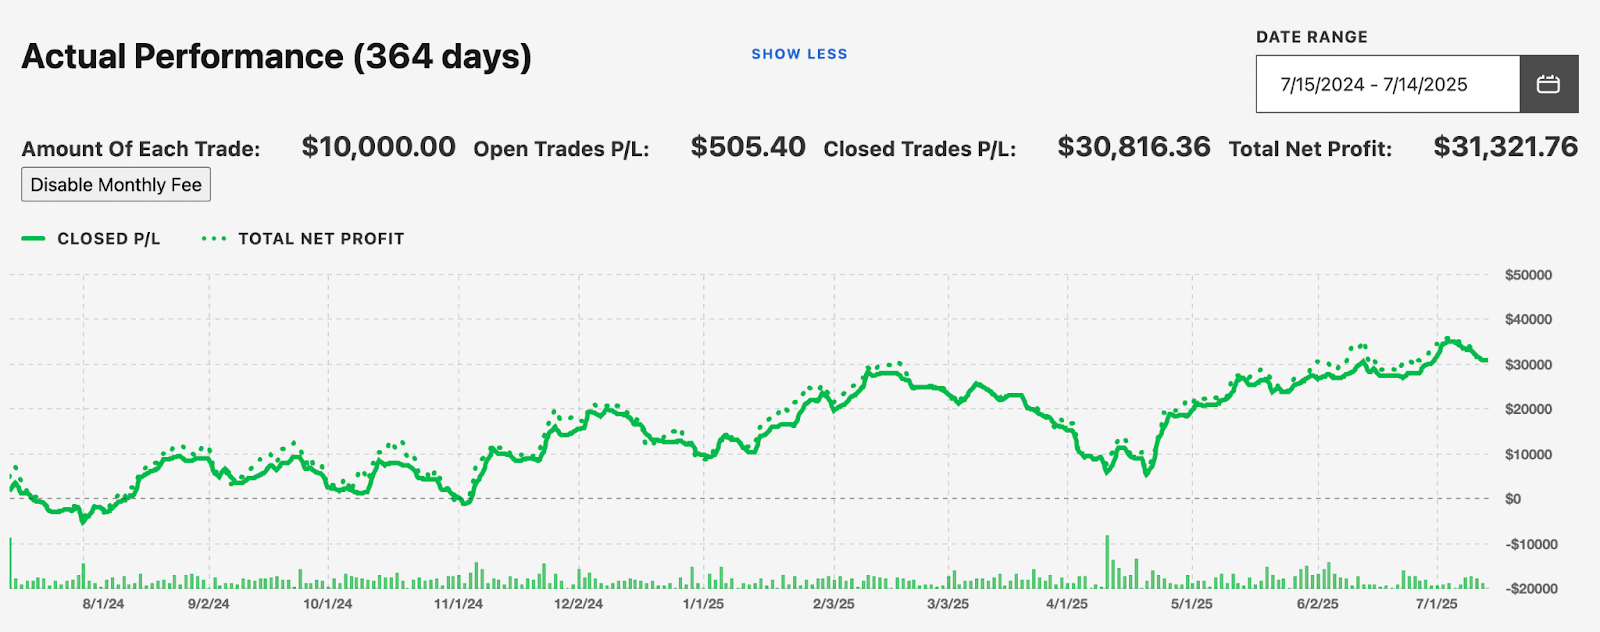
Over 364 days, this bot delivered impressive net performance without margin: a total net profit of $31,321.76 on $10,000 per-trade allocations, translating to an annualized return of 8.56%. With 679 profitable trades (39.85% win rate) averaging $408.55 each, and a profit factor of 1.13, it showcases resilience—the profit/drawdown ratio stands at 1.24, high for its category. Maximum consecutive wins reached 27 trades ($13,039.18), highlighting streak potential in favorable conditions like post-earnings rallies. In medium volatility (optimal for this bot), it balances growth and stability, far outpacing manual trading's emotional pitfalls.
Users can monitor live paper trades in the "Open Trades" tab or review historical ones in "Closed Trades" on the bot's page: Trend Trader: Popular Stocks, 60 min, (TA&FA). Net results deduct subscription fees, ensuring transparency, and all stats stem from real-time Morningstar data simulations, eliminating hindsight bias.
Swing Trader: High Volatility Stocks for Active Trading, 60 min, (TA&FA) – Virtual Agent
Tailored for volatile names like (JPM), this bot balances long/short positions to mitigate downtrends, using uptrend reversal indicators for entries. It's suited for traders managing 30-40 trades, with a swift 1-day average duration—ideal for quick earnings plays. Position sizing scales with account balance (e.g., $4,000 per trade on $100,000), offering flexibility.
Strategic highlights:
- Selection and Entry: Proprietary momentum assessment of active U.S. stocks, combined with neural-processed TA pools.
- Exit Strategy: 3.5% take-profit, 3% stop-loss, and trailing stops for profit preservation.
- Volatility Management: Medium volatility rating, with medium-high diversification to hedge sector risks.
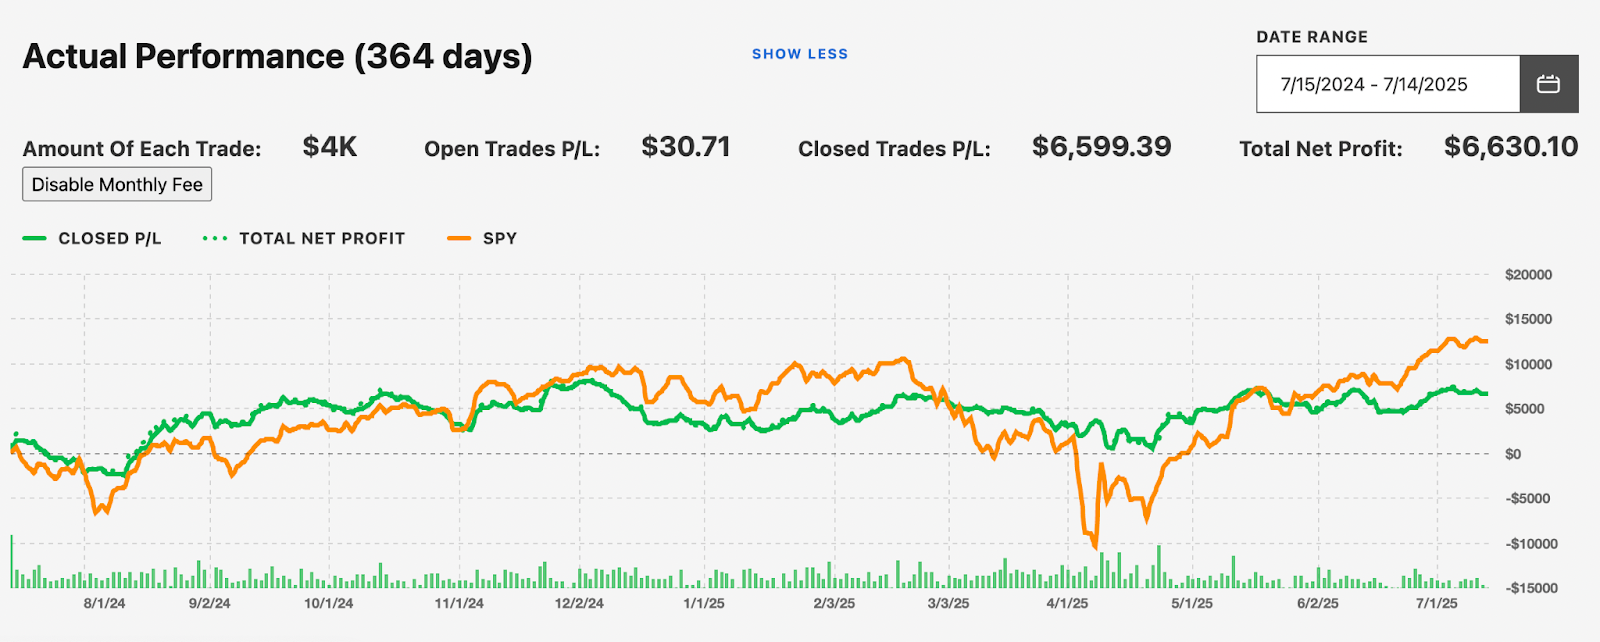
In 364 days, it achieved a total net profit of $6,630.10 on $4,000 trades, yielding a 6.60% annualized return. With 1,047 profitable trades (50.63% win rate) averaging $131.80, and a profit factor of 1.06, it demonstrates steady gains. Notable: 19 consecutive wins ($2,731.28) and a balanced profit/drawdown of 0.84, making it accessible for intermediates and experts. Like its counterpart, performance uses real-time data, with gross figures before fees and net charts reflecting user costs.
Explore it here: Swing Trader: High Volatility Stocks for Active Trading, 60 min, (TA&FA). The bot's medium optimal market condition aligns with current VIX levels (indicator forthcoming), positioning it for earnings-induced swings.
Why AI Bots Outperform Manual Trading in Earnings Seasons
Manual trading during earnings demands constant vigilance—analyzing reports, gauging sentiment, and timing entries. Tickeron's bots automate this with FLMs that adapt continuously, processing minute-by-minute data for predictive signals. Benefits include:
- Efficiency: Track dozens of positions effortlessly, freeing time for strategy oversight.
- Profitability: High profit/drawdown ratios ensure returns outweigh risks, with backtests proving edge in diverse markets.
- Accessibility: No advanced coding needed; bots run on paper or live modes, serving novices to pros.
- Innovation: The new 5- and 15-minute frames enhance responsiveness, as seen in forward tests showing superior accuracy.
In volatile periods like this week's earnings, these bots have traded JPM, WFC, and C successfully, turning data into actionable profits. For instance, the Trend Trader's high max open positions diversify away from single-ticker risks, while the Swing Trader's short duration captures quick post-earnings pops.
Ready to elevate your trading? Visit Tickeron to access these AI Trading Bots, explore full stats, and start with a free trial. Whether you're eyeing JPM's NII update or BLK's AUM surge, Tickeron's tools empower you to trade smarter, not harder.
Contributor
Financial writer and active order flow futures trader with a focus on fundamental analysis, macroeconomic factors, and equity research. I make in-depth blogs on stocks and ETFs, bridging the gap between raw market data and real-world trading decisions.

Advertisement