
SPY August 2025 Outlook: In-Depth Financial Market Analysis
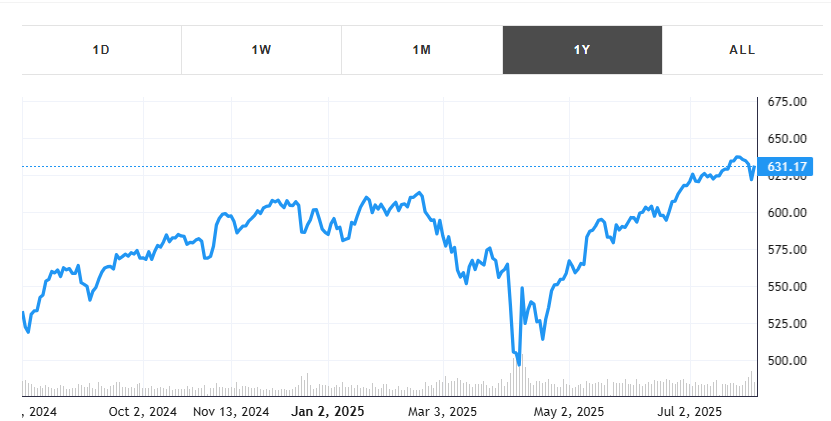
The SPDR S&P 500 ETF Trust (ASX:SPY), designed to track the performance of the S&P 500 Index, is a cornerstone of global investment portfolios. Representing 500 of the largest U.S. companies across diverse sectors, SPY serves as a reliable barometer of the U.S. economy and a key instrument for investors seeking broad market exposure. As of August 5, 2025, SPY closed at $631.17, reflecting a 1.52% increase from the previous day, with a trading volume of 73 million shares amounting to $45.88 billion. This article provides a comprehensive 6000-word analysis of SPY’s market movement forecast for August 2025, integrating financial analysis, macroeconomic trends, technical indicators, AI-driven insights, and popular market news as of August 5, 2025. By leveraging advanced data analytics and AI tools, this forecast aims to equip investors with actionable insights while acknowledging the inherent uncertainties in financial markets.
SPY’s Historical Performance and Current Market Position
Historical Context and Growth Trends
Since its inception in 1993, SPY has grown from a modest asset base to over $570.603 billion in market capitalization as of August 4, 2025. Its assets under management (AUM) reached $500 billion by 2023, driven by consistent revenue growth from $1.2 billion in 2019 to $2.4 billion in 2023, and profits rising from $900 million to $1.7 billion over the same period. The ETF’s low expense ratio of 0.09% and a dividend yield of approximately 1.5% make it a cost-effective and attractive option for investors. Over the past decade, SPY has delivered an annualized return of approximately 12.8%, outperforming many actively managed funds.
In 2025, SPY has shown resilience despite market volatility. Year-to-date (YTD) as of June 12, 2025, SPY gained 1.38%, closing at $599.53 with a 52-week range of $503.22 to $614.87. The ETF’s recent performance, including a 1.37% gain over five trading days in June 2025, reflects robust investor confidence amid mixed economic signals. However, volatility persists, with a 0.38% gain over the last two weeks as of August 4, 2025, and a 1.00% fluctuation on the most recent trading day.Current Technical Indicators
Technical analysis provides critical insights into SPY’s short-term trajectory. As of August 4, 2025, key indicators include:
- Relative Strength Index (RSI): The RSI(14) stands at 64.37, indicating neutral sentiment, neither overbought nor oversold.
- Stochastic Oscillator (STOCH): A value of 78.06 suggests balanced market sentiment without extreme buying or selling pressure.
- Average Directional Index (ADX): At 32.39, the ADX indicates a moderate trend, supporting potential trades in the direction of the current uptrend.
- Commodity Channel Index (CCI): A CCI(14) value of 40.11 reflects neutral short-term sentiment.
- Moving Average Convergence Divergence (MACD): The MACD turned positive on July 25, 2025, with historical data suggesting a 52-case upward trend continuation in similar scenarios.
- Moving Averages: The 50-day moving average ($601.22) crossed above the 200-day moving average ($585.47) on June 27, 2025, signaling a long-term bullish trend.
These indicators collectively suggest a cautiously optimistic outlook, with SPY trading above key resistance levels ($633) and supported by institutional absorption around $615–$620. However, a sell signal from the short-term moving average and a pivot top on July 25, 2025, indicate potential downside risks.
Macroeconomic Factors Influencing SPY’s August 2025 Outlook
Federal Reserve Policy and Interest Rates
The Federal Reserve’s monetary policy remains a pivotal driver of SPY’s performance. As of July 31, 2025, the Fed maintained the federal funds rate at 5.50%, with a 91% probability of no rate hike in August, according to CME FedWatch. Inflation, cooling to a CPI of ~3.2% and PCE of ~2.6%, remains sticky, while the labor market shows signs of slowing but not collapsing. The Fed’s cautious stance, with only two projected rate cuts for 2025, reflects concerns about liquidity compression and potential risk-off conditions. A hawkish hold could push SPY toward support levels at $627, while a dovish surprise might drive it to $645 or higher.
Tariff Policies and Global Trade Dynamics
President Donald Trump’s tariff policies, reintroduced in 2025, have significantly impacted market sentiment. Following a near-bear market decline in April 2025 due to a major tariff announcement, SPY rebounded after the tariff pause. However, new tariffs set at 35% for Canada, effective August 1, 2025, and proposed rates of 25%–40% on key trading partners could double the effective U.S. import tariff rate to 20%. These policies may increase consumer prices, potentially dampening corporate earnings and SPY’s growth. Conversely, a U.S.–EU trade deal with a 15% tariff rate, signed before August 2025, has sparked optimism, pushing SPY to new highs.
Corporate Earnings and Sector Performance
Corporate earnings within the S&P 500 have been a bright spot, with broader sector participation in 2025. Unlike 2023 and 2024, when technology and communication services dominated, industrials, utilities, and financials are among the top performers. Q1 2025 earnings from companies like Johnson & Johnson (NYSE:JNJ) (+5.8% sales) and Carnival Corporation (LON:CCL) ($6.3 billion revenue) highlight sectoral strength. However, tech giants like NVIDIA (NASDAQ:NVDA), Tesla (NASDAQ:TSLA), Meta (NASDAQ:META), Palantir, and Amazon (NASDAQ:AMZN), which surged over 40% in April 2025, continue to drive significant SPY gains. Goldman Sachs (NYSE:GS) projects AI-driven productivity gains could boost U.S. GDP by 2027, supporting corporate earnings and SPY valuations.
AI-Driven Insights and Trading Strategies of AI in Market Forecasting
Artificial intelligence has revolutionized financial analysis, offering real-time insights into SPY’s price movements. Platforms like Tickeron leverage Financial Learning Models (FLMs) to analyze volume trends, macroeconomic factors, and technical indicators. For instance, Tickeron’s AI identified a bullish moving average crossover on May 15, 2025, predicting an upside to $610, which SPY achieved by June. With reported win rates of up to 86.6% for leveraged ETFs, AI tools provide critical support and resistance levels ($590 and $610, respectively) for traders.
AI-driven trading bots, such as Tickeron’s Double Agent Bot, have outperformed traditional strategies, posting a +9.77% quarterly gain while the S&P 500 dropped 9.28% in Q2 2025. These bots use real-time intraday signals and inverse ETF strategies to manage volatility, offering investors a hedge against potential SPY declines.
Sentiment Analysis from Social Media
Posts on X as of August 5, 2025, reveal mixed sentiment. Optimistic views, such as @market_sleuth’s prediction of SPY reaching $640 before a shallow 5% retracement to $606, contrast with bearish outlooks from @TriggerTrades, citing stretched RSIs and a bearish seasonality shift in August/September. @saxena_puru notes elevated pullback risks in Q3, while @TrendSpider highlights the positive impact of the U.S.–EU trade deal. This mixed sentiment underscores the need for cautious, data-driven trading strategies.
Popular Market News as of August 5, 2025
U.S.: EU Trade Deal Boosts Optimism
A significant market-moving event is the U.S.–EU trade framework agreement, setting a 15% tariff rate on most EU imports. Announced before August 2025, this deal averted harsher penalties, driving SPY and the Nasdaq to record highs. Tesla’s $16.5 billion AI chip deal with Samsung further bolstered tech sector sentiment, indirectly supporting SPY.
Tariff Concerns and Market Volatility
The reintroduction of 35% tariffs on Canada, effective August 1, 2025, has renewed volatility concerns. Posts on X, such as @SuperLuckeee’s prediction of a 5%–10% SPY sell-off in August/September, reflect fears of tariff-driven inflation. The Yale Budget Lab estimates that a doubling of the effective tariff rate could pressure consumer spending, impacting SPY’s constituent companies.
Federal Reserve’s Policy Stance
The Fed’s decision to hold rates at 4.25%–4.50% during the July 29–30, 2025, FOMC meeting, coupled with political pressure from President Trump for rate cuts, has created uncertainty. Chair Powell’s concerns about central bank independence and mixed economic data (e.g., strong GDP rebound but slowing labor market) suggest a cautious approach, potentially capping SPY’s upside.
Corporate Earnings Highlights
Recent earnings reports underscore SPY’s diversified strength. Philip Morris (NYSE:PM) International’s Q2 2025 results, driven by IQOS and ZYN growth, and Dollar General’s $847.2 million cash flow surge in Q1 2025 highlight resilience in consumer sectors. However, tariff threats could squeeze budget-conscious shoppers, posing risks to retail-heavy SPY holdings.
Short-Term Forecast for August 2025Price Predictions and Technical Outlook
Analysts offer varied price predictions for SPY in August 2025:
- 30rates.com: Forecasts SPY rising from $632.08 to $646.85 by month-end, a 2.3% increase, with a maximum of $698.60 and a minimum of $576.93. Daily forecasts include $627.26 on August 5 and $635.41 by August 12.
- TradingView (VolanX Protocol): Predicts a mild bearish drift to $627.46 (-1.4%) or $616.68 (-2.9%) by August 30, with support at $627 and resistance at $639–$645.
- Stockinvest.us: Estimates a 11.78% rise over three months, with SPY potentially reaching $696.21–$719.52, but notes short-term sell signals from MACD and pivot tops.
Technical analysis suggests SPY is in a strong short-term uptrend, with a breakout above the ascending channel and support at $615–$620. However, a clean break below $636.65 could trigger a larger retracement to $600 or $580, aligning with liquidity zones.
Key Risks and Opportunities
Risks:
- Tariff Impact: Higher tariffs could increase costs, reducing corporate margins and SPY’s growth.
- Seasonal Weakness: Historical data indicates August/September as bearish months, with @saxena_puru noting Q3 turbulence risks.
- Overbought Conditions: RSI and Fear & Greed Index (75) suggest potential overheating, increasing correction risks.
Opportunities
:
- AI-Driven Gains: Continued AI adoption could boost tech-heavy SPY holdings, with Goldman Sachs forecasting GDP growth by 2027.
- Sector Diversification: Strength in industrials, utilities, and financials provides a buffer against tech volatility.
- Trade Deal Optimism: The U.S.–EU agreement could sustain bullish momentum if tariff negotiations progress.
Long-Term Outlook: 2026–2030Price Projections
Long-term forecasts for SPY are broadly optimistic:
- 2026: Stockscan.io predicts an average price of $662.95, with a high of $738.97 (+8.35% from $611.87). 30rates.com projects $855.38 by August 2026 (+1.7% from July).
- 2027: Stockscan.io estimates $723.98, with a high of $775.64 (+18.32%). 30rates.com forecasts $1073.09 by July (+3.0% from June).
- 2030: Stockscan.io projects $755.63 (+21.59%), while Walletinvestor.com estimates $869.656 (+36.5%). AltIndex predicts $751.76, and googstock.org ranges between $764–$772
These projections reflect sustained U.S. economic growth, AI-driven productivity, and demographic shifts, with Millennials and Gen Z driving consumer spending.
Structural Trends
- AI and Automation: Goldman Sachs forecasts AI contributing to GDP growth by 2027, supporting SPY’s tech-heavy components.
- Demographic Shifts: Fundstrat’s Tom Lee predicts the S&P 500 reaching 15,000 by 2030, driven by younger generations’ economic influence.
- Emerging Markets: Goldman Sachs projects emerging markets’ share of global equity rising to 35% by 2030, potentially diversifying SPY’s exposure.
Strategic Recommendations for InvestorsShort-Term Strategies
- Swing Trading: Use AI tools like Tickeron’s Double Agent Bot to capitalize on intraday signals, targeting support ($627) and resistance ($645) levels.
- Hedging: Consider inverse ETFs or put options to mitigate downside risks, especially if SPY breaks below $636.65.
- Monitor Macro (BCBA:BMAm) Events: Watch FOMC statements, tariff negotiations, and Q2 2025 earnings for volatility triggers.
Long-Term Strategies
- Buy-and-Hold: SPY’s low expense ratio and historical 12.8% annualized return make it ideal for long-term portfolios.
- Diversification: Complement SPY with sector-specific ETFs (e.g., industrials, utilities) to balance tech exposure.
- AI Integration: Leverage AI trading platforms for real-time insights and risk management.
Financial Learning Models (FLMs)
Sergey Savastiouk, Ph.D., CEO of Tickeron, emphasizes the importance of technical analysis in managing market volatility. Through Financial Learning Models (FLMs), Tickeron integrates AI with technical analysis, allowing traders to spot patterns more accurately and make better-informed decisions. Beginner-friendly robots and high-liquidity stock robots offered by Tickeron provide traders with real-time insights, enhancing control and transparency in fast-moving markets.
An advanced AI-driven financial analysis platform plays a pivotal role in forecasting SPY’s market movements for August 2025. By leveraging Financial Learning Models (FLMs), Tickeron analyzes vast datasets, including volume trends, macroeconomic indicators, and technical signals, to deliver precise predictions. For instance, its AI accurately predicted SPY’s rise to $610 following a bullish moving average crossover on May 15, 2025, with reported win rates of up to 86.6% for leveraged ETF strategies. The platform’s Double Agent Bot, achieving a +9.77% quarterly gain in Q2 2025 despite a broader market decline, provides real-time intraday signals and supports inverse ETF strategies to navigate volatility. By offering support and resistance levels ($590 and $610) and sentiment analysis from platforms like X, Tickeron empowers investors with actionable insights to optimize SPY trading decisions.
Conclusion: Navigating August 2025 with Caution and Optimism
SPY’s forecast for August 2025 reflects a complex interplay of bullish and bearish forces. Technical indicators and AI-driven insights suggest a short-term uptrend with potential resistance at $645 and support at $627. Macroeconomic factors, including Fed policy and tariffs, introduce volatility, while strong corporate earnings and trade deal optimism provide upside potential. Investors should adopt a balanced approach, using AI tools for precision and hedging strategies to manage risks. Long-term, SPY remains a robust investment, with projections of significant growth by 2030 driven by AI, demographics, and economic expansion. As always, consult a professional financial advisor before making investment decisions, as market predictions carry inherent uncertainties.
Contributor
Serhii Bondarenko is an AI-focused trading strategist and financial markets analyst specializing in the development and application of AI trading bots and autonomous trading agents. His work combines technical analysis, fundamental analysis, and quantitative research to identify market patterns, forecast price movements, and analyze liquidity, volatility, and correlations across global stock markets. Serhii actively publishes market insights, forecasts, and trading frameworks on platforms such as Investing.com and Finextra, with a strong focus on AI-driven decision-making and next-generation algorithmic trading. His research aims to bridge the gap between traditional trading methodologies and advanced artificial intelligence, helping traders and investors navigate complex and rapidly evolving market conditions.

Advertisement