CDEI Stock Tickeron detected bearish ETF Pattern: Head-and-Shoulders Top on November 25, 2025


at Tickeron.com


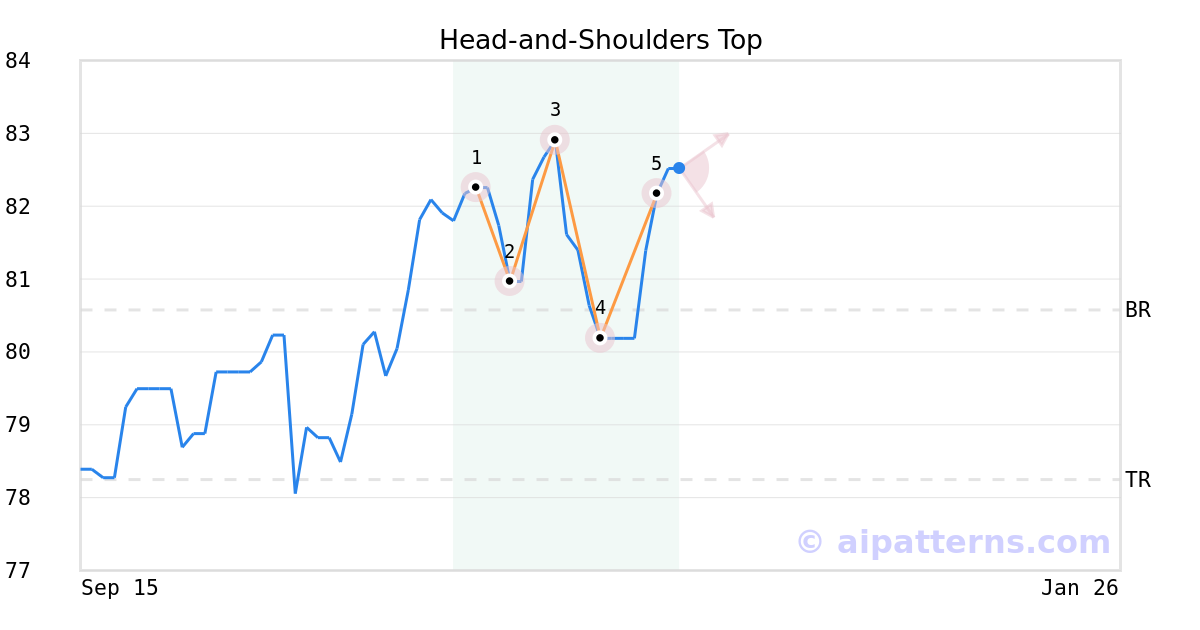
A.I.dvisor detected a bearish Head-and-Shoulders Top pattern for CDEI stock. This pattern was detected on November 25, 2025 . The odds of reaching the target price are 6.
The pattern forms with a center peak (the Head, labeled 3) and left and right Shoulders (1, 5). Eventually the security stops testing highs and reverses trend into a decline.
Consider selling a security short before it declines or buying a put option to benefit from the price decline. To improve success chances, wait for a confirmation move: allow the price to break below the Neckline level (2, 4), which is calculated as the average of the two lows between the Head and the Shoulders.
CDEI's MACD Histogram crosses above signal line
The Moving Average Convergence Divergence (MACD) for CDEI turned positive on November 28, 2025. Looking at past instances where CDEI's MACD turned positive, the stock continued to rise in of 29 cases over the following month. The odds of a continued upward trend are .

Technical Analysis (Indicators)
Bullish Trend Analysis
The Momentum Indicator moved above the 0 level on November 28, 2025. You may want to consider a long position or call options on CDEI as a result. In of 43 past instances where the momentum indicator moved above 0, the stock continued to climb. The odds of a continued upward trend are .
Following a 3-day Advance, the price is estimated to grow further. Considering data from situations where CDEI advanced for three days, in of 162 cases, the price rose further within the following month. The odds of a continued upward trend are .
The Aroon Indicator entered an Uptrend today. In of 254 cases where CDEI Aroon's Indicator entered an Uptrend, the price rose further within the following month. The odds of a continued Uptrend are .
Bearish Trend Analysis
The 10-day RSI Indicator for CDEI moved out of overbought territory on November 05, 2025. This could be a bearish sign for the stock. Traders may want to consider selling the stock or buying put options. Tickeron's A.I.dvisor looked at 22 similar instances where the indicator moved out of overbought territory. In of the 22 cases, the stock moved lower in the following days. This puts the odds of a move lower at .
The Stochastic Oscillator has been in the overbought zone for 1 day. Expect a price pull-back in the near future.
Following a 3-day decline, the stock is projected to fall further. Considering past instances where CDEI declined for three days, the price rose further in of 62 cases within the following month. The odds of a continued downward trend are .
CDEI broke above its upper Bollinger Band on October 27, 2025. This could be a sign that the stock is set to drop as the stock moves back below the upper band and toward the middle band. You may want to consider selling the stock or exploring put options.
Advertisement
General Information
Category LargeBlend