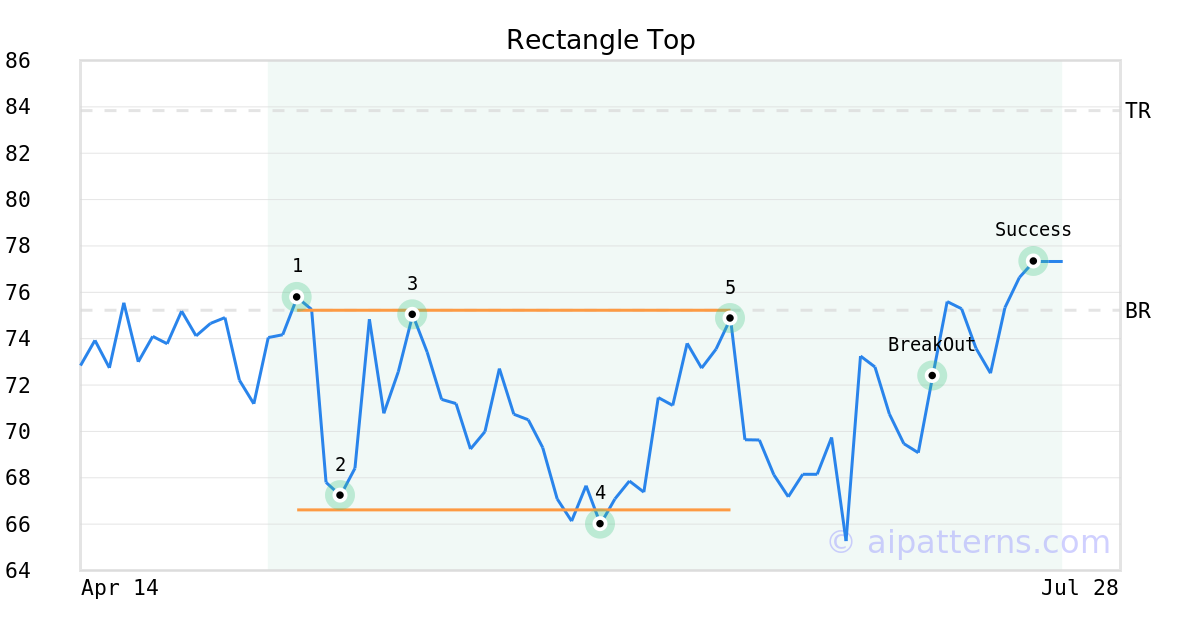
CNR Stock Tickeron detected bullish Stock Pattern: Rectangle Top CNR on July 10, 2025, netting in a 3.29% gain over 1 month


at Tickeron.com


CNR in upward trend: 10-day moving average crossed above 50-day moving average on July 11, 2025
The 10-day moving average for CNR crossed bullishly above the 50-day moving average on July 11, 2025. This indicates that the trend has shifted higher and could be considered a buy signal. In of 18 past instances when the 10-day crossed above the 50-day, the stock continued to move higher over the following month. The odds of a continued upward trend are .

Technical Analysis (Indicators)
Bullish Trend Analysis
The Momentum Indicator moved above the 0 level on July 09, 2025. You may want to consider a long position or call options on CNR as a result. In of 84 past instances where the momentum indicator moved above 0, the stock continued to climb. The odds of a continued upward trend are .
The Moving Average Convergence Divergence (MACD) for CNR just turned positive on July 02, 2025. Looking at past instances where CNR's MACD turned positive, the stock continued to rise in of 52 cases over the following month. The odds of a continued upward trend are .
CNR moved above its 50-day moving average on July 10, 2025 date and that indicates a change from a downward trend to an upward trend.
Following a 3-day Advance, the price is estimated to grow further. Considering data from situations where CNR advanced for three days, in of 312 cases, the price rose further within the following month. The odds of a continued upward trend are .
Bearish Trend Analysis
The 10-day RSI Indicator for CNR moved out of overbought territory on July 23, 2025. This could be a bearish sign for the stock. Traders may want to consider selling the stock or buying put options. Tickeron's A.I.dvisor looked at 50 similar instances where the indicator moved out of overbought territory. In of the 50 cases, the stock moved lower in the following days. This puts the odds of a move lower at .
The Stochastic Oscillator may be shifting from an upward trend to a downward trend. In of 63 cases where CNR's Stochastic Oscillator exited the overbought zone, the price fell further within the following month. The odds of a continued downward trend are .
Following a 3-day decline, the stock is projected to fall further. Considering past instances where CNR declined for three days, the price rose further in of 62 cases within the following month. The odds of a continued downward trend are .
CNR broke above its upper Bollinger Band on July 22, 2025. This could be a sign that the stock is set to drop as the stock moves back below the upper band and toward the middle band. You may want to consider selling the stock or exploring put options.


Advertisement