PNNT Stock Tickeron detected bearish Stock Pattern: Broadening Wedge Descending PNNT on September 22, 2025, netting in a 6.40% gain over 2 months


at Tickeron.com


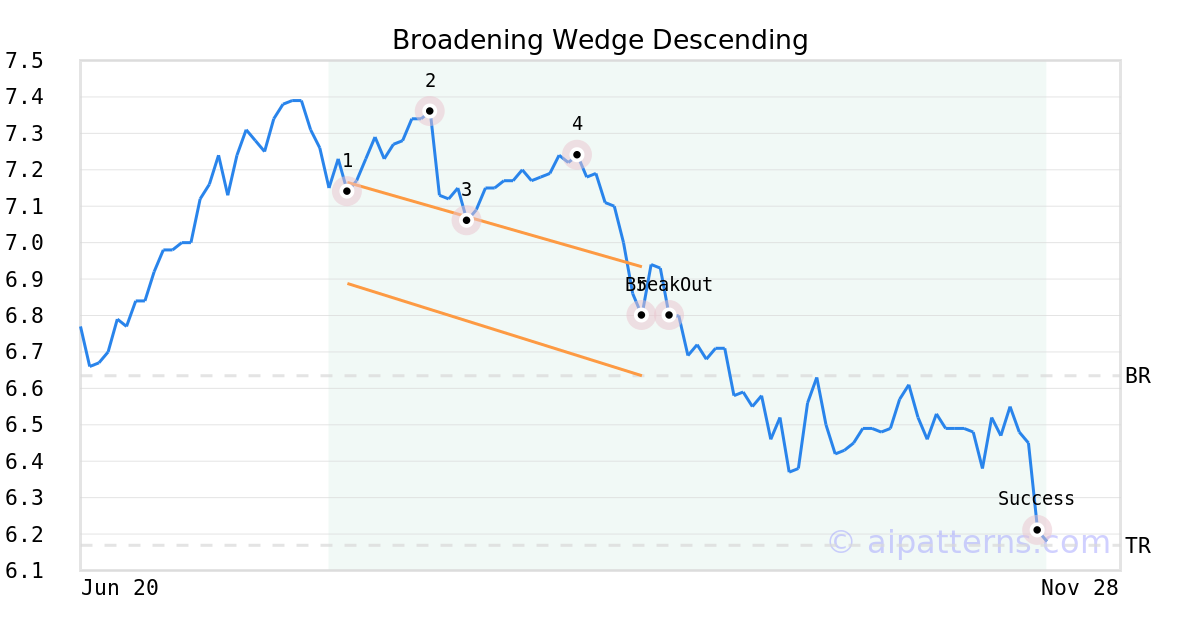
On September 17, 2025, A.I.dvisor detected a Broadening Wedge Descending Pattern (Bearish) for Pennant Investment Corp (PNNT, $6.63). 5 days later, on September 22, 2025, A.I.dvisor confirmed the Bearish pattern, setting a target price of the stock. On November 17, 2025, the stock hit the target price of $6.17 – resulting in a gain for traders who shorted the stock on the pattern detection date.
PNNT sees MACD Histogram just turned negative
PNNT saw its Moving Average Convergence Divergence Histogram (MACD) turn negative on November 17, 2025. This is a bearish signal that suggests the stock could decline going forward. Tickeron's A.I.dvisor looked at 51 instances where the indicator turned negative. In of the 51 cases the stock moved lower in the days that followed. This puts the odds of a downward move at .

Technical Analysis (Indicators)
Bearish Trend Analysis
The Momentum Indicator moved below the 0 level on November 14, 2025. You may want to consider selling the stock, shorting the stock, or exploring put options on PNNT as a result. In of 96 cases where the Momentum Indicator fell below 0, the stock fell further within the subsequent month. The odds of a continued downward trend are .
Following a 3-day decline, the stock is projected to fall further. Considering past instances where PNNT declined for three days, the price rose further in of 62 cases within the following month. The odds of a continued downward trend are .
Bullish Trend Analysis
The Stochastic Oscillator is in the oversold zone. Keep an eye out for a move up in the foreseeable future.
Following a 3-day Advance, the price is estimated to grow further. Considering data from situations where PNNT advanced for three days, in of 315 cases, the price rose further within the following month. The odds of a continued upward trend are .
PNNT may jump back above the lower band and head toward the middle band. Traders may consider buying the stock or exploring call options.
The Aroon Indicator entered an Uptrend today. In of 318 cases where PNNT Aroon's Indicator entered an Uptrend, the price rose further within the following month. The odds of a continued Uptrend are .
Fundamental Analysis (Ratings)
The Tickeron Valuation Rating of (best 1 - 100 worst) indicates that the company is seriously undervalued in the industry. This rating compares market capitalization estimated by our proprietary formula with the current market capitalization. This rating is based on the following metrics, as compared to industry averages: P/B Ratio (0.844) is normal, around the industry mean (4.680). P/E Ratio (7.762) is within average values for comparable stocks, (29.433). Projected Growth (PEG Ratio) (0.000) is also within normal values, averaging (2.480). Dividend Yield (0.155) settles around the average of (0.082) among similar stocks. P/S Ratio (6.618) is also within normal values, averaging (21.333).
The Tickeron Profit vs. Risk Rating rating for this company is (best 1 - 100 worst), indicating low risk on high returns. The average Profit vs. Risk Rating rating for the industry is 74, placing this stock better than average.
The Tickeron SMR rating for this company is (best 1 - 100 worst), indicating strong sales and a profitable business model. SMR (Sales, Margin, Return on Equity) rating is based on comparative analysis of weighted Sales, Income Margin and Return on Equity values compared against S&P 500 index constituents. The weighted SMR value is a proprietary formula developed by Tickeron and represents an overall profitability measure for a stock.
The Tickeron Price Growth Rating for this company is (best 1 - 100 worst), indicating fairly steady price growth. PNNT’s price grows at a lower rate over the last 12 months as compared to S&P 500 index constituents.
The Tickeron PE Growth Rating for this company is (best 1 - 100 worst), pointing to worse than average earnings growth. The PE Growth rating is based on a comparative analysis of stock PE ratio increase over the last 12 months compared against S&P 500 index constituents.
Advertisement
General Information
a private equity fund
Industry InvestmentManagers