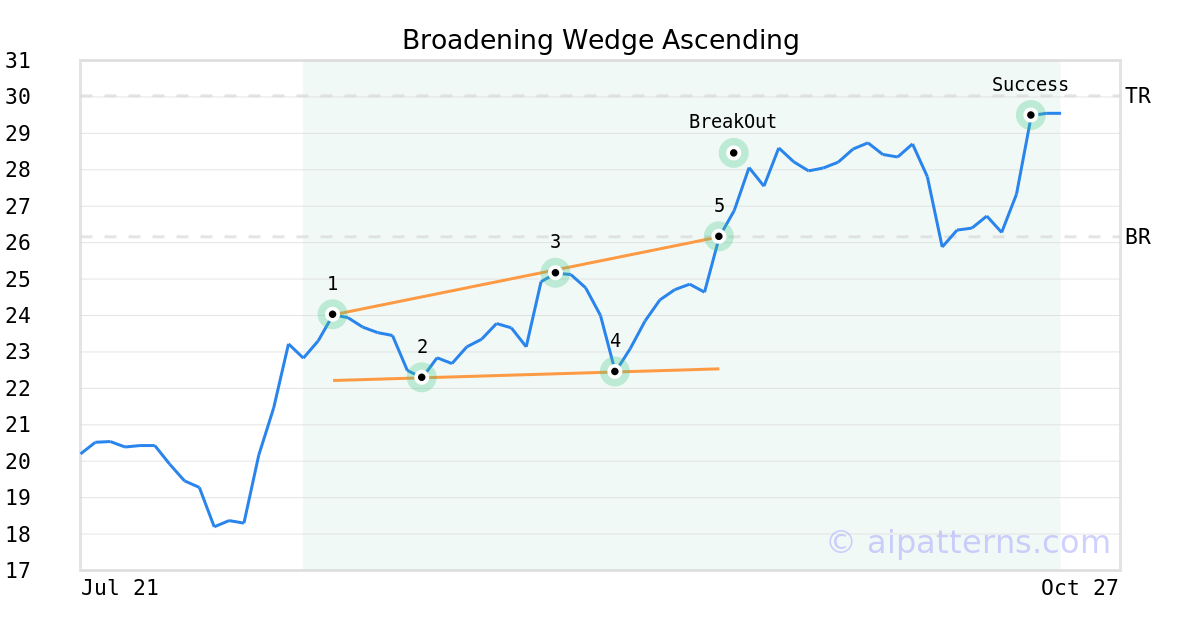
AAPX Stock Tickeron detected bullish ETF Pattern: Broadening Wedge Ascending AAPX on September 22, 2025, netting in a 12.73% gain over 1 month


at Tickeron.com


AAPX's MACD Histogram just turned positive
The Moving Average Convergence Divergence (MACD) for AAPX turned positive on October 23, 2025. Looking at past instances where AAPX's MACD turned positive, the stock continued to rise in of 17 cases over the following month. The odds of a continued upward trend are .

Technical Analysis (Indicators)
Bullish Trend Analysis
The Momentum Indicator moved above the 0 level on October 23, 2025. You may want to consider a long position or call options on AAPX as a result. In of 27 past instances where the momentum indicator moved above 0, the stock continued to climb. The odds of a continued upward trend are .
Following a 3-day Advance, the price is estimated to grow further. Considering data from situations where AAPX advanced for three days, in of 121 cases, the price rose further within the following month. The odds of a continued upward trend are .
AAPX may jump back above the lower band and head toward the middle band. Traders may consider buying the stock or exploring call options.
The Aroon Indicator entered an Uptrend today. In of 90 cases where AAPX Aroon's Indicator entered an Uptrend, the price rose further within the following month. The odds of a continued Uptrend are .
Bearish Trend Analysis
The 10-day RSI Indicator for AAPX moved out of overbought territory on October 06, 2025. This could be a bearish sign for the stock. Traders may want to consider selling the stock or buying put options. Tickeron's A.I.dvisor looked at 12 similar instances where the indicator moved out of overbought territory. In of the 12 cases, the stock moved lower in the following days. This puts the odds of a move lower at .
The Stochastic Oscillator demonstrated that the ticker has stayed in the overbought zone for 3 days. The longer the ticker stays in the overbought zone, the sooner a price pull-back is expected.
Following a 3-day decline, the stock is projected to fall further. Considering past instances where AAPX declined for three days, the price rose further in of 62 cases within the following month. The odds of a continued downward trend are .


Advertisement
General Information
Category Trading