ADVE Stock Tickeron detected bearish ETF Pattern: Triangle Symmetrical Bottom on November 07, 2025


at Tickeron.com


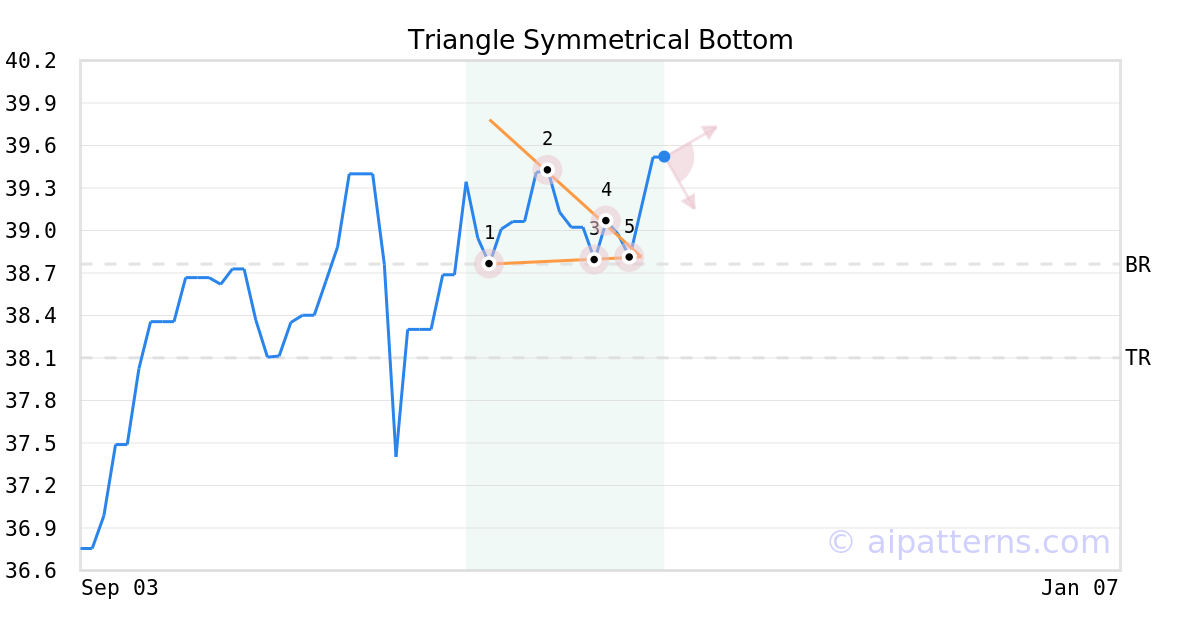
A.I.dvisor detected a bearish Triangle Symmetrical Bottom pattern for ADVE stock. This pattern was detected on November 07, 2025 . The odds of reaching the target price are 6.
The Symmetrical Triangle Bottom pattern forms when the price of a security fails to retest a high or a low and ultimately forms two narrowing trend lines. Points (1, 5) form the triangle patterns.
Consider selling the security short or buying a put option at the downward breakout price level. When trading, wait for the confirmation move, which is when the price falls below the breakout level.
ADVE in -0.66% downward trend, falling for three consecutive days on November 07, 2025
Moving lower for three straight days is viewed as a bearish sign. Keep an eye on this stock for future declines. Considering data from situations where ADVE declined for three days, in of 73 cases, the price declined further within the following month. The odds of a continued downward trend are .

Technical Analysis (Indicators)
Bearish Trend Analysis
The Stochastic Oscillator may be shifting from an upward trend to a downward trend. In of 26 cases where ADVE's Stochastic Oscillator exited the overbought zone, the price fell further within the following month. The odds of a continued downward trend are .
The Moving Average Convergence Divergence Histogram (MACD) for ADVE turned negative on November 17, 2025. This could be a sign that the stock is set to turn lower in the coming weeks. Traders may want to sell the stock or buy put options. Tickeron's A.I.dvisor looked at 19 similar instances when the indicator turned negative. In of the 19 cases the stock turned lower in the days that followed. This puts the odds of success at .
Bullish Trend Analysis
The Momentum Indicator moved above the 0 level on November 18, 2025. You may want to consider a long position or call options on ADVE as a result. In of 32 past instances where the momentum indicator moved above 0, the stock continued to climb. The odds of a continued upward trend are .
Following a 3-day Advance, the price is estimated to grow further. Considering data from situations where ADVE advanced for three days, in of 98 cases, the price rose further within the following month. The odds of a continued upward trend are .
The Aroon Indicator entered an Uptrend today. In of 150 cases where ADVE Aroon's Indicator entered an Uptrend, the price rose further within the following month. The odds of a continued Uptrend are .
Advertisement
General Information
Category DiversifiedPacificAsia