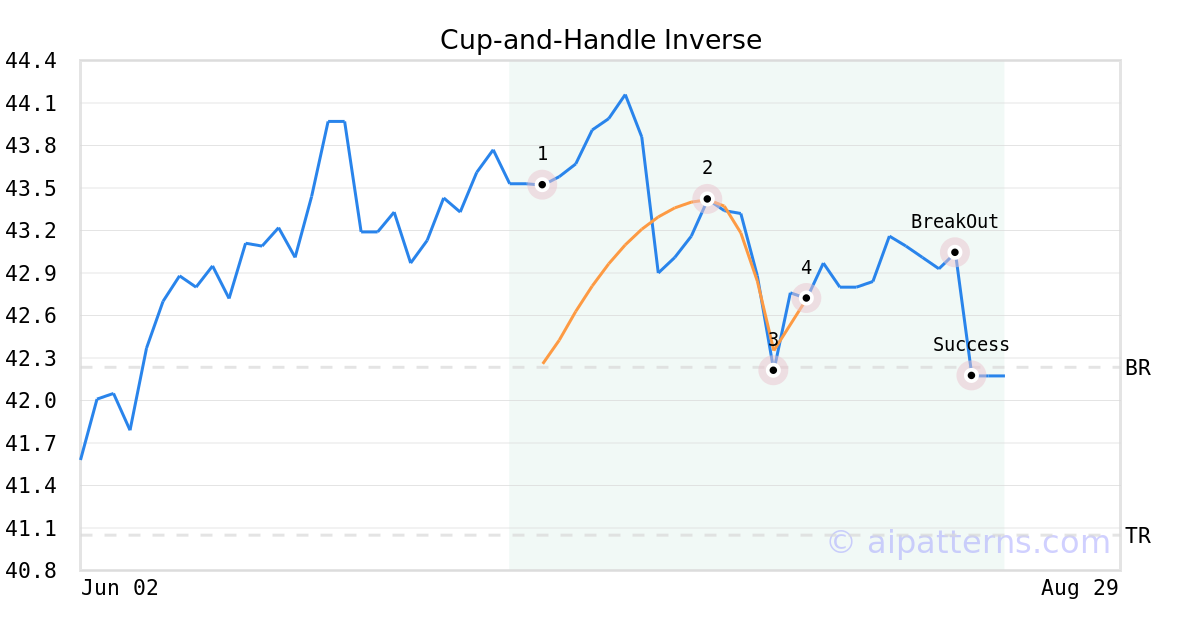
AIPI Stock Tickeron detected bearish ETF Pattern: Cup-and-Handle Inverse AIPI on August 18, 2025, netting in a 1.28% gain over 2 weeks


at Tickeron.com


AIPI's Indicator enters downward trend
The Aroon Indicator for AIPI entered a downward trend on August 28, 2025. Tickeron's A.I.dvisor identified a pattern where the AroonDown red line was above 70 while the AroonUp green line was below 30 for three straight days. This could indicate a strong downward move is ahead for the stock. Traders may want to consider selling the stock or buying put options. A.I.dvisor looked at 11 similar instances where the Aroon Indicator formed such a pattern. In of the 11 cases the stock moved lower. This puts the odds of a downward move at .

Technical Analysis (Indicators)
Bearish Trend Analysis
The 10-day RSI Indicator for AIPI moved out of overbought territory on July 31, 2025. This could be a bearish sign for the stock. Traders may want to consider selling the stock or buying put options. Tickeron's A.I.dvisor looked at 12 similar instances where the indicator moved out of overbought territory. In of the 12 cases, the stock moved lower in the following days. This puts the odds of a move lower at .
The Stochastic Oscillator entered the overbought zone. Expect a price pull-back in the foreseeable future.
Following a 3-day decline, the stock is projected to fall further. Considering past instances where AIPI declined for three days, the price rose further in of 62 cases within the following month. The odds of a continued downward trend are .
Bullish Trend Analysis
The Momentum Indicator moved above the 0 level on August 28, 2025. You may want to consider a long position or call options on AIPI as a result. In of 13 past instances where the momentum indicator moved above 0, the stock continued to climb. The odds of a continued upward trend are .
AIPI moved above its 50-day moving average on August 22, 2025 date and that indicates a change from a downward trend to an upward trend.
Following a 3-day Advance, the price is estimated to grow further. Considering data from situations where AIPI advanced for three days, in of 106 cases, the price rose further within the following month. The odds of a continued upward trend are .
AIPI may jump back above the lower band and head toward the middle band. Traders may consider buying the stock or exploring call options.


Advertisement