AKA Stock Tickeron detected bullish Stock Pattern: Head-and-Shoulders Bottom on November 13, 2025


at Tickeron.com


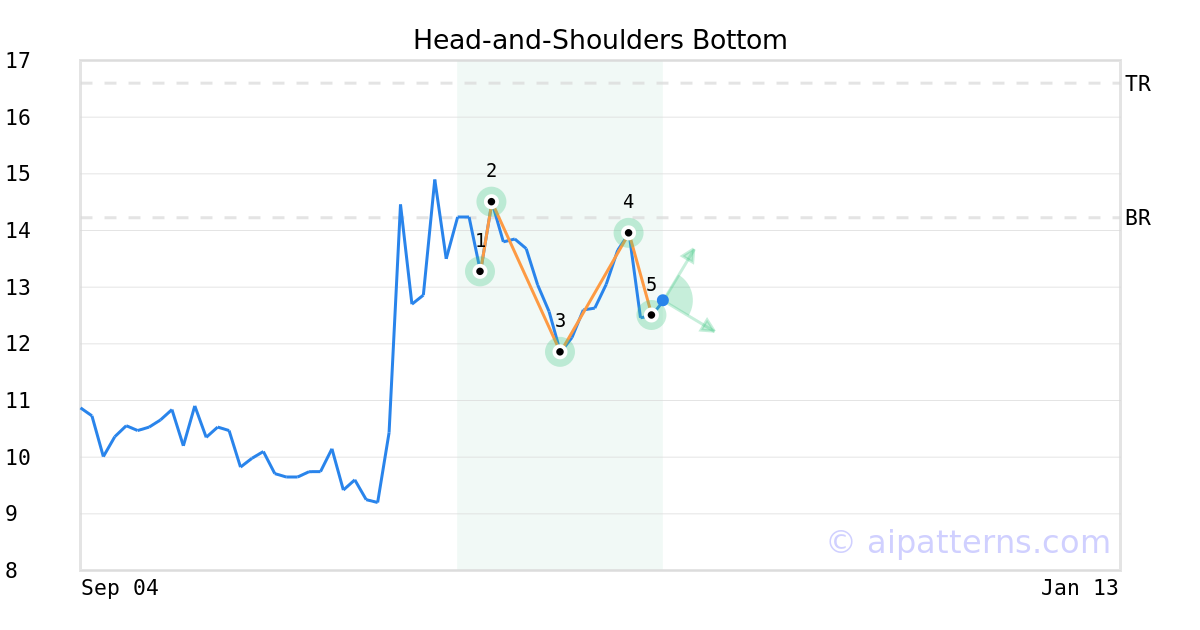
A.I.dvisor detected a bullish Head-and-Shoulders Bottom pattern for AKA stock. This pattern was detected on November 13, 2025 . The odds of reaching the target price are 6.
The Head-and-Shoulders Bottom pattern is formed when the price of a security creates a center trough (the inverted head, labeled 3) and the left and right inverted shoulders (1, 5). After reaching the lowest low (the Head, 3) the next low is shallower and the trend reverses course to the upside.
Consider buying a security or a call option at the low once the pattern is confirmed, which is known as the breakout point. The pattern is confirmed when the price breaks above the Neckline (2,4).
AKA in upward trend: price rose above 50-day moving average on October 14, 2025
AKA moved above its 50-day moving average on October 14, 2025 date and that indicates a change from a downward trend to an upward trend. In of 40 similar past instances, the stock price increased further within the following month. The odds of a continued upward trend are .

Technical Analysis (Indicators)
Bullish Trend Analysis
The Momentum Indicator moved above the 0 level on November 14, 2025. You may want to consider a long position or call options on AKA as a result. In of 72 past instances where the momentum indicator moved above 0, the stock continued to climb. The odds of a continued upward trend are .
The 10-day moving average for AKA crossed bullishly above the 50-day moving average on October 16, 2025. This indicates that the trend has shifted higher and could be considered a buy signal. In of 13 past instances when the 10-day crossed above the 50-day, the stock continued to move higher over the following month. The odds of a continued upward trend are .
Following a 3-day Advance, the price is estimated to grow further. Considering data from situations where AKA advanced for three days, in of 206 cases, the price rose further within the following month. The odds of a continued upward trend are .
AKA may jump back above the lower band and head toward the middle band. Traders may consider buying the stock or exploring call options.
Bearish Trend Analysis
The 10-day RSI Indicator for AKA moved out of overbought territory on October 20, 2025. This could be a bearish sign for the stock. Traders may want to consider selling the stock or buying put options. Tickeron's A.I.dvisor looked at 23 similar instances where the indicator moved out of overbought territory. In of the 23 cases, the stock moved lower in the following days. This puts the odds of a move lower at .
The Stochastic Oscillator may be shifting from an upward trend to a downward trend. In of 49 cases where AKA's Stochastic Oscillator exited the overbought zone, the price fell further within the following month. The odds of a continued downward trend are .
The Moving Average Convergence Divergence Histogram (MACD) for AKA turned negative on October 31, 2025. This could be a sign that the stock is set to turn lower in the coming weeks. Traders may want to sell the stock or buy put options. Tickeron's A.I.dvisor looked at 41 similar instances when the indicator turned negative. In of the 41 cases the stock turned lower in the days that followed. This puts the odds of success at .
Following a 3-day decline, the stock is projected to fall further. Considering past instances where AKA declined for three days, the price rose further in of 62 cases within the following month. The odds of a continued downward trend are .
Fundamental Analysis (Ratings)
The Tickeron PE Growth Rating for this company is (best 1 - 100 worst), pointing to outstanding earnings growth. The PE Growth rating is based on a comparative analysis of stock PE ratio increase over the last 12 months compared against S&P 500 index constituents.
The Tickeron Price Growth Rating for this company is (best 1 - 100 worst), indicating fairly steady price growth. AKA’s price grows at a lower rate over the last 12 months as compared to S&P 500 index constituents.
The Tickeron Valuation Rating of (best 1 - 100 worst) indicates that the company is fair valued in the industry. This rating compares market capitalization estimated by our proprietary formula with the current market capitalization. This rating is based on the following metrics, as compared to industry averages: P/B Ratio (1.215) is normal, around the industry mean (6.280). P/E Ratio (0.000) is within average values for comparable stocks, (31.894). AKA's Projected Growth (PEG Ratio) (0.000) is slightly lower than the industry average of (2.309). AKA has a moderately low Dividend Yield (0.000) as compared to the industry average of (0.031). P/S Ratio (0.224) is also within normal values, averaging (4.797).
The Tickeron SMR rating for this company is (best 1 - 100 worst), indicating weak sales and an unprofitable business model. SMR (Sales, Margin, Return on Equity) rating is based on comparative analysis of weighted Sales, Income Margin and Return on Equity values compared against S&P 500 index constituents. The weighted SMR value is a proprietary formula developed by Tickeron and represents an overall profitability measure for a stock.
The Tickeron Profit vs. Risk Rating rating for this company is (best 1 - 100 worst), indicating that the returns do not compensate for the risks. AKA’s unstable profits reported over time resulted in significant Drawdowns within these last five years. A stable profit reduces stock drawdown and volatility. The average Profit vs. Risk Rating rating for the industry is 79, placing this stock worse than average.
Advertisement
General Information
Industry ApparelFootwearRetail