ARB.X Crypto Tickeron detected bullish Crypto Pattern: Broadening Bottom on October 30, 2025


at Tickeron.com


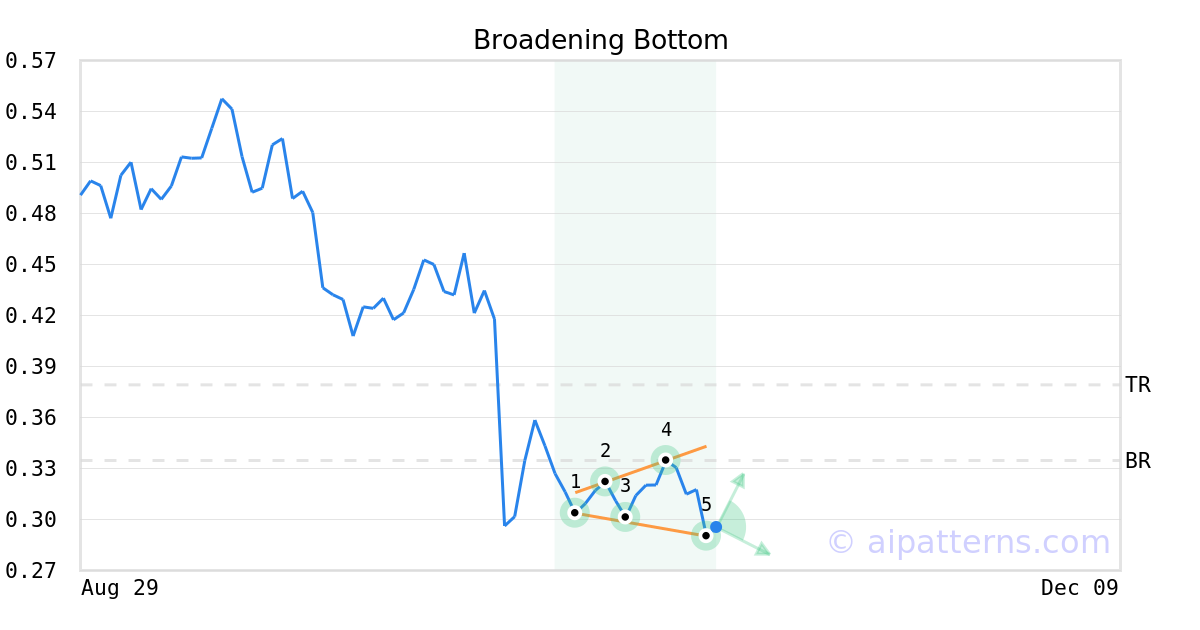
A.I.dvisor detected a bullish Broadening Bottom pattern for ARB.X stock. This pattern was detected on October 30, 2025 . The odds of reaching the target price are 7.
The Broadening Bottom pattern is formed when the price of a security progressively makes higher highs (2, 4) and lower lows (1, 3, 5) following two widening trend lines.
Consider buying a security or call option at the upward breakout price/entry point.
ARB.X in +2.08% Uptrend, rising for three consecutive days on November 27, 2025
Moving higher for three straight days is viewed as a bullish sign. Keep an eye on this stock for future growth. Considering data from situations where ARB.X advanced for three days, in of 222 cases, the price rose further within the following month. The odds of a continued upward trend are .

Technical Analysis (Indicators)
Bullish Trend Analysis
The RSI Indicator points to a transition from a downward trend to an upward trend -- in cases where ARB.X's RSI Indicator exited the oversold zone, of 32 resulted in an increase in price. Tickeron's analysis proposes that the odds of a continued upward trend are .
The Stochastic Oscillator suggests the stock price trend may be in a reversal from a downward trend to an upward trend. of 54 cases where ARB.X's Stochastic Oscillator exited the oversold zone resulted in an increase in price. Tickeron's analysis proposes that the odds of a continued upward trend are .
The Moving Average Convergence Divergence (MACD) for ARB.X just turned positive on November 25, 2025. Looking at past instances where ARB.X's MACD turned positive, the stock continued to rise in of 32 cases over the following month. The odds of a continued upward trend are .
ARB.X may jump back above the lower band and head toward the middle band. Traders may consider buying the stock or exploring call options.
Bearish Trend Analysis
The Momentum Indicator moved below the 0 level on November 11, 2025. You may want to consider selling the stock, shorting the stock, or exploring put options on ARB.X as a result. In of 62 cases where the Momentum Indicator fell below 0, the stock fell further within the subsequent month. The odds of a continued downward trend are .
The 50-day moving average for ARB.X moved below the 200-day moving average on October 31, 2025. This could be a long-term bearish signal for the stock as the stock shifts to an downward trend.
Following a 3-day decline, the stock is projected to fall further. Considering past instances where ARB.X declined for three days, the price rose further in of 62 cases within the following month. The odds of a continued downward trend are .
The Aroon Indicator for ARB.X entered a downward trend on November 27, 2025. This could indicate a strong downward move is ahead for the stock. Traders may want to consider selling the stock or buying put options.