ARDR.X Crypto Tickeron detected bearish Crypto Pattern: Cup-and-Handle Inverse on November 24, 2025


at Tickeron.com


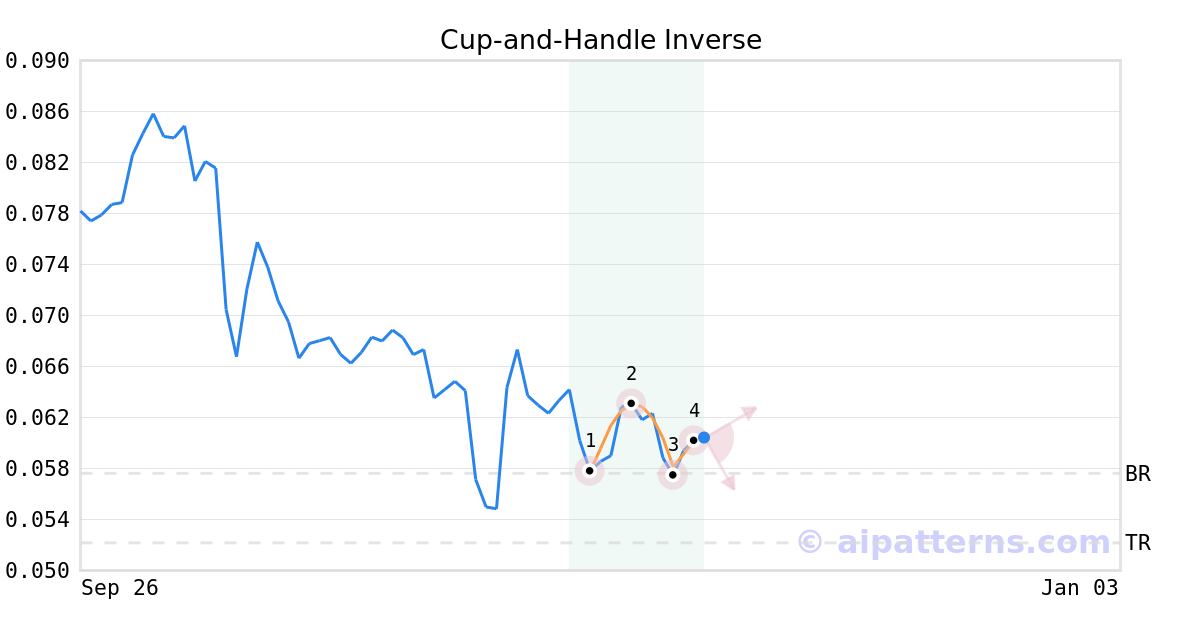
A.I.dvisor detected a bearish Cup-and-Handle Inverse pattern for ARDR.X stock. This pattern was detected on November 24, 2025 . The odds of reaching the target price are .
The Inverted Cup-and-Handle (sometimes called Inverted Cup-and-Holder) pattern forms when prices rise then decline to create an upside-down “U”like shape (1, 2, 3, also known as the Cup), followed by a shorter relatively straight price increase that bounces from the right lip (from 3 to 4, creating the Handle).
Consider selling the security short or buying a put option at the downward breakout level. The confirmation move is the breakout of the price below the right cup lip.
Momentum Indicator for ARDR.X turns negative, indicating new downward trend
ARDR.X saw its Momentum Indicator move below the 0 level on November 30, 2025. This is an indication that the stock could be shifting in to a new downward move. Traders may want to consider selling the stock or exploring put options. Tickeron's A.I.dvisor looked at 135 similar instances where the indicator turned negative. In of the 135 cases, the stock moved further down in the following days. The odds of a decline are at .

Technical Analysis (Indicators)
Bearish Trend Analysis
ARDR.X moved below its 50-day moving average on November 30, 2025 date and that indicates a change from an upward trend to a downward trend.
Following a 3-day decline, the stock is projected to fall further. Considering past instances where ARDR.X declined for three days, the price rose further in of 62 cases within the following month. The odds of a continued downward trend are .
The Aroon Indicator for ARDR.X entered a downward trend on November 05, 2025. This could indicate a strong downward move is ahead for the stock. Traders may want to consider selling the stock or buying put options.
Bullish Trend Analysis
The RSI Oscillator points to a transition from a downward trend to an upward trend -- in cases where ARDR.X's RSI Indicator exited the oversold zone, of 33 resulted in an increase in price. Tickeron's analysis proposes that the odds of a continued upward trend are .
The Stochastic Oscillator suggests the stock price trend may be in a reversal from a downward trend to an upward trend. of 101 cases where ARDR.X's Stochastic Oscillator exited the oversold zone resulted in an increase in price. Tickeron's analysis proposes that the odds of a continued upward trend are .
The Moving Average Convergence Divergence (MACD) for ARDR.X just turned positive on November 07, 2025. Looking at past instances where ARDR.X's MACD turned positive, the stock continued to rise in of 72 cases over the following month. The odds of a continued upward trend are .
Following a +1 3-day Advance, the price is estimated to grow further. Considering data from situations where ARDR.X advanced for three days, in of 488 cases, the price rose further within the following month. The odds of a continued upward trend are .
ARDR.X may jump back above the lower band and head toward the middle band. Traders may consider buying the stock or exploring call options.