ARKQ Stock Tickeron detected bearish ETF Pattern: Broadening Bottom ARKQ on November 06, 2025, netting in a 6.96% gain over 1 week


at Tickeron.com


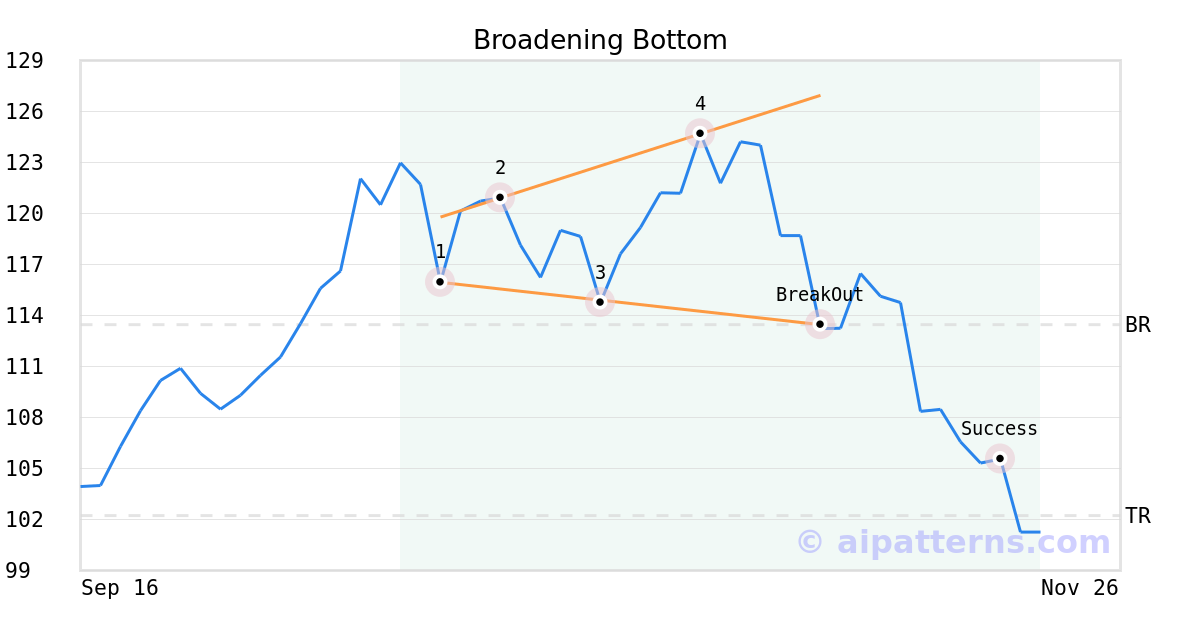
On November 06, 2025, A.I.dvisor detected a Broadening Bottom Pattern (Bearish) for ARK Autonomous Technology&Robotics ETF (ARKQ, $113.46). On November 06, 2025, A.I.dvisor confirmed the Bearish pattern, setting a target price of the stock. On November 19, 2025, the stock hit the target price of $102.23 – resulting in a gain for traders who shorted the stock on the pattern detection date.
ARKQ in -2.91% downward trend, sliding for three consecutive days on November 18, 2025
Moving lower for three straight days is viewed as a bearish sign. Keep an eye on this stock for future declines. Considering data from situations where ARKQ declined for three days, in of 287 cases, the price declined further within the following month. The odds of a continued downward trend are .

Technical Analysis (Indicators)
Bearish Trend Analysis
The Momentum Indicator moved below the 0 level on November 06, 2025. You may want to consider selling the stock, shorting the stock, or exploring put options on ARKQ as a result. In of 76 cases where the Momentum Indicator fell below 0, the stock fell further within the subsequent month. The odds of a continued downward trend are .
ARKQ moved below its 50-day moving average on November 13, 2025 date and that indicates a change from an upward trend to a downward trend.
The 10-day moving average for ARKQ crossed bearishly below the 50-day moving average on November 17, 2025. This indicates that the trend has shifted lower and could be considered a sell signal. In of 15 past instances when the 10-day crossed below the 50-day, the stock continued to move higher over the following month. The odds of a continued downward trend are .
Bullish Trend Analysis
The RSI Indicator points to a transition from a downward trend to an upward trend -- in cases where ARKQ's RSI Indicator exited the oversold zone, of 31 resulted in an increase in price. Tickeron's analysis proposes that the odds of a continued upward trend are .
The Stochastic Oscillator shows that the ticker has stayed in the oversold zone for 7 days. The price of this ticker is presumed to bounce back soon, since the longer the ticker stays in the oversold zone, the more promptly an upward trend is expected.
Following a 3-day Advance, the price is estimated to grow further. Considering data from situations where ARKQ advanced for three days, in of 338 cases, the price rose further within the following month. The odds of a continued upward trend are .
ARKQ may jump back above the lower band and head toward the middle band. Traders may consider buying the stock or exploring call options.
The Aroon Indicator entered an Uptrend today. In of 303 cases where ARKQ Aroon's Indicator entered an Uptrend, the price rose further within the following month. The odds of a continued Uptrend are .
Advertisement
General Information
Category Technology