ARPA.X Crypto Tickeron detected bearish Crypto Pattern: Pennant ARPA.X on November 27, 2025, netting in a 3.28% gain over 3 days


at Tickeron.com


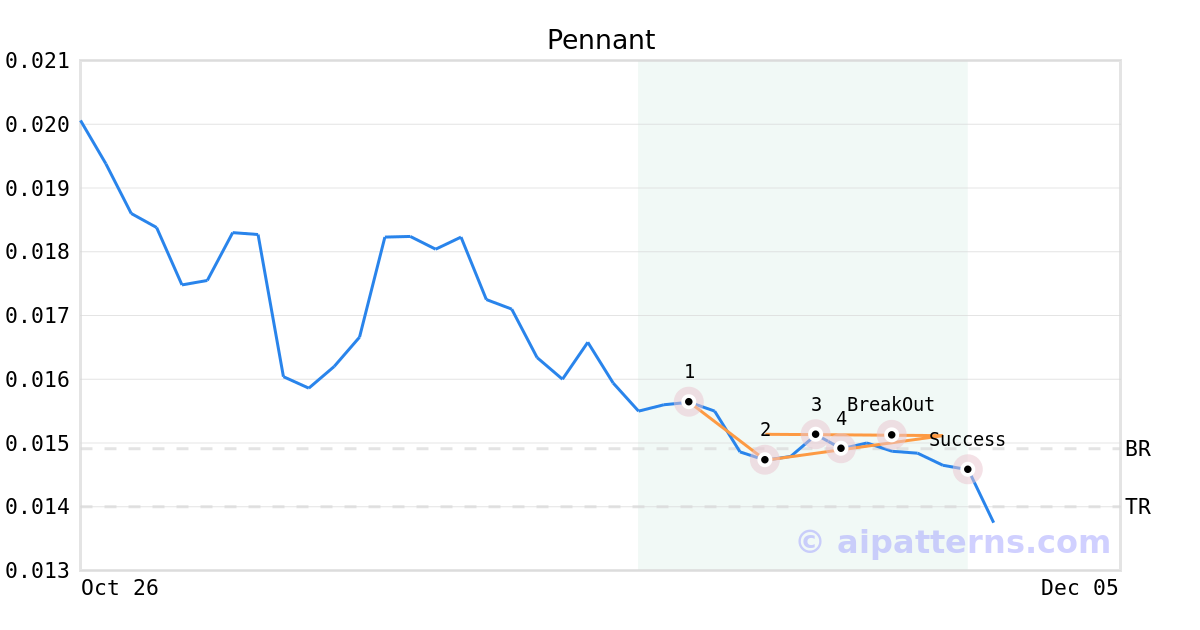
On November 27, 2025, A.I.dvisor detected a Pennant Pattern (Bearish) for ARPA cryptocurrency (ARPA.X, $0.015103). On November 27, 2025, A.I.dvisor confirmed the Bearish pattern, setting a target price of the stock. On November 30, 2025, the stock hit the target price of $0.014000 – resulting in a gain for traders who shorted the stock on the pattern detection date.
ARPA.X's Indicator enters downward trend
The Aroon Indicator for ARPA.X entered a downward trend on November 27, 2025. Tickeron's A.I.dvisor identified a pattern where the AroonDown red line was above 70 while the AroonUp green line was below 30 for three straight days. This could indicate a strong downward move is ahead for the stock. Traders may want to consider selling the stock or buying put options. A.I.dvisor looked at 195 similar instances where the Aroon Indicator formed such a pattern. In of the 195 cases the stock moved lower. This puts the odds of a downward move at .

Technical Analysis (Indicators)
Bearish Trend Analysis
The Momentum Indicator moved below the 0 level on November 16, 2025. You may want to consider selling the stock, shorting the stock, or exploring put options on ARPA.X as a result. In of 138 cases where the Momentum Indicator fell below 0, the stock fell further within the subsequent month. The odds of a continued downward trend are .
Following a 3-day decline, the stock is projected to fall further. Considering past instances where ARPA.X declined for three days, the price rose further in of 62 cases within the following month. The odds of a continued downward trend are .
Bullish Trend Analysis
The RSI Indicator entered the oversold zone -- be on the watch for ARPA.X's price rising or consolidating in the future. That's also the time to consider buying the stock or exploring call options.
The Stochastic Oscillator is in the oversold zone. Keep an eye out for a move up in the foreseeable future.
The Moving Average Convergence Divergence (MACD) for ARPA.X just turned positive on November 26, 2025. Looking at past instances where ARPA.X's MACD turned positive, the stock continued to rise in of 72 cases over the following month. The odds of a continued upward trend are .
Following a 3-day Advance, the price is estimated to grow further. Considering data from situations where ARPA.X advanced for three days, in of 431 cases, the price rose further within the following month. The odds of a continued upward trend are .
ARPA.X may jump back above the lower band and head toward the middle band. Traders may consider buying the stock or exploring call options.