ATGL Stock Tickeron detected bearish Stock Pattern: Pennant ATGL on October 27, 2025, netting in a 34.97% gain over 2 weeks


at Tickeron.com


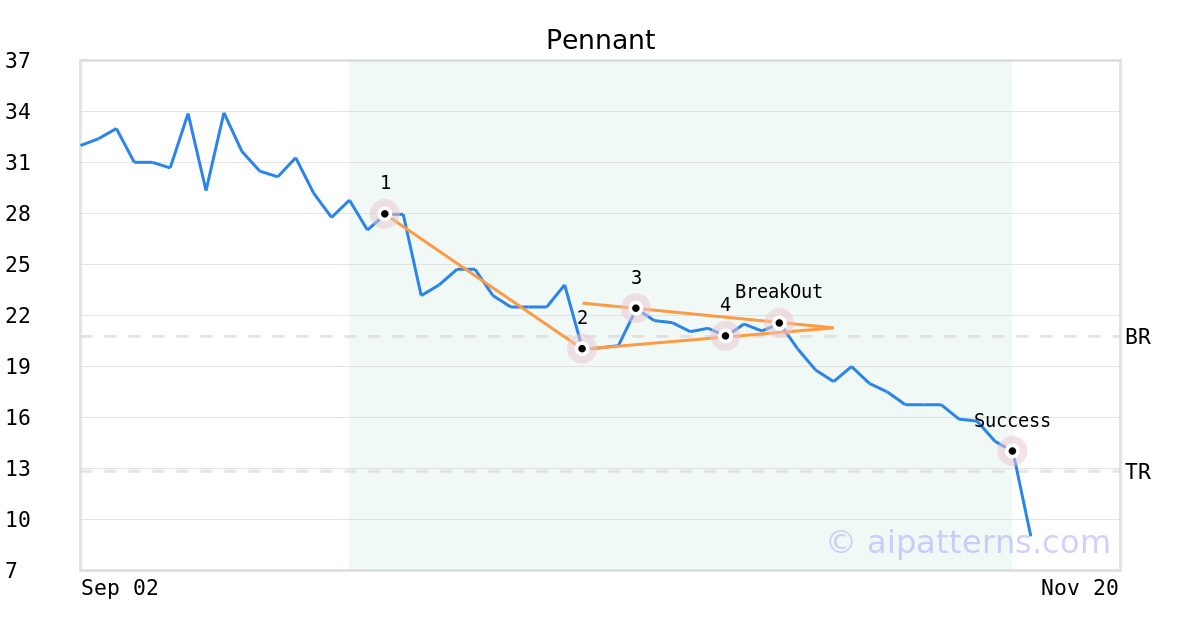
On October 27, 2025, A.I.dvisor detected a Pennant Pattern (Bearish) for Alpha Technology Group Limited (ATGL, $21.53). On October 27, 2025, A.I.dvisor confirmed the Bearish pattern, setting a target price of the stock. On November 13, 2025, the stock hit the target price of $12.84 – resulting in a +3 gain for traders who shorted the stock on the pattern detection date.
ATGL sees its 50-day moving average cross bearishly below its 200-day moving average
The 50-day moving average for ATGL moved below the 200-day moving average on November 06, 2025. This could be a long-term bearish signal for the stock as the stock shifts to an downward trend.

Technical Analysis (Indicators)
Bearish Trend Analysis
Following a 3-day decline, the stock is projected to fall further. Considering past instances where ATGL declined for three days, the price rose further in of 62 cases within the following month. The odds of a continued downward trend are .
The Aroon Indicator for ATGL entered a downward trend on November 14, 2025. This could indicate a strong downward move is ahead for the stock. Traders may want to consider selling the stock or buying put options.
Bullish Trend Analysis
The RSI Indicator points to a transition from a downward trend to an upward trend -- in cases where ATGL's RSI Indicator exited the oversold zone, of 8 resulted in an increase in price. Tickeron's analysis proposes that the odds of a continued upward trend are .
The Stochastic Oscillator suggests the stock price trend may be in a reversal from a downward trend to an upward trend. of 21 cases where ATGL's Stochastic Oscillator exited the oversold zone resulted in an increase in price. Tickeron's analysis proposes that the odds of a continued upward trend are .
The Momentum Indicator moved above the 0 level on November 17, 2025. You may want to consider a long position or call options on ATGL as a result. In of 34 past instances where the momentum indicator moved above 0, the stock continued to climb. The odds of a continued upward trend are .
The Moving Average Convergence Divergence (MACD) for ATGL just turned positive on November 17, 2025. Looking at past instances where ATGL's MACD turned positive, the stock continued to rise in of 14 cases over the following month. The odds of a continued upward trend are .
ATGL may jump back above the lower band and head toward the middle band. Traders may consider buying the stock or exploring call options.
Fundamental Analysis (Ratings)
The Tickeron Price Growth Rating for this company is (best 1 - 100 worst), indicating steady price growth. ATGL’s price grows at a higher rate over the last 12 months as compared to S&P 500 index constituents.
The Tickeron Valuation Rating of (best 1 - 100 worst) indicates that the company is significantly overvalued in the industry. This rating compares market capitalization estimated by our proprietary formula with the current market capitalization. This rating is based on the following metrics, as compared to industry averages: P/B Ratio (49.261) is normal, around the industry mean (15.571). P/E Ratio (0.000) is within average values for comparable stocks, (164.990). ATGL's Projected Growth (PEG Ratio) (0.000) is slightly lower than the industry average of (1.611). ATGL has a moderately low Dividend Yield (0.000) as compared to the industry average of (0.026). P/S Ratio (222.222) is also within normal values, averaging (81.767).
The Tickeron PE Growth Rating for this company is (best 1 - 100 worst), pointing to worse than average earnings growth. The PE Growth rating is based on a comparative analysis of stock PE ratio increase over the last 12 months compared against S&P 500 index constituents.
The Tickeron SMR rating for this company is (best 1 - 100 worst), indicating weak sales and an unprofitable business model. SMR (Sales, Margin, Return on Equity) rating is based on comparative analysis of weighted Sales, Income Margin and Return on Equity values compared against S&P 500 index constituents. The weighted SMR value is a proprietary formula developed by Tickeron and represents an overall profitability measure for a stock.
The Tickeron Profit vs. Risk Rating rating for this company is (best 1 - 100 worst), indicating that the returns do not compensate for the risks. ATGL’s unstable profits reported over time resulted in significant Drawdowns within these last five years. A stable profit reduces stock drawdown and volatility. The average Profit vs. Risk Rating rating for the industry is 91, placing this stock worse than average.
Advertisement
General Information
Industry ComputerCommunications