AVMA Stock Tickeron detected bearish ETF Pattern: Broadening Wedge Descending on November 17, 2025


at Tickeron.com


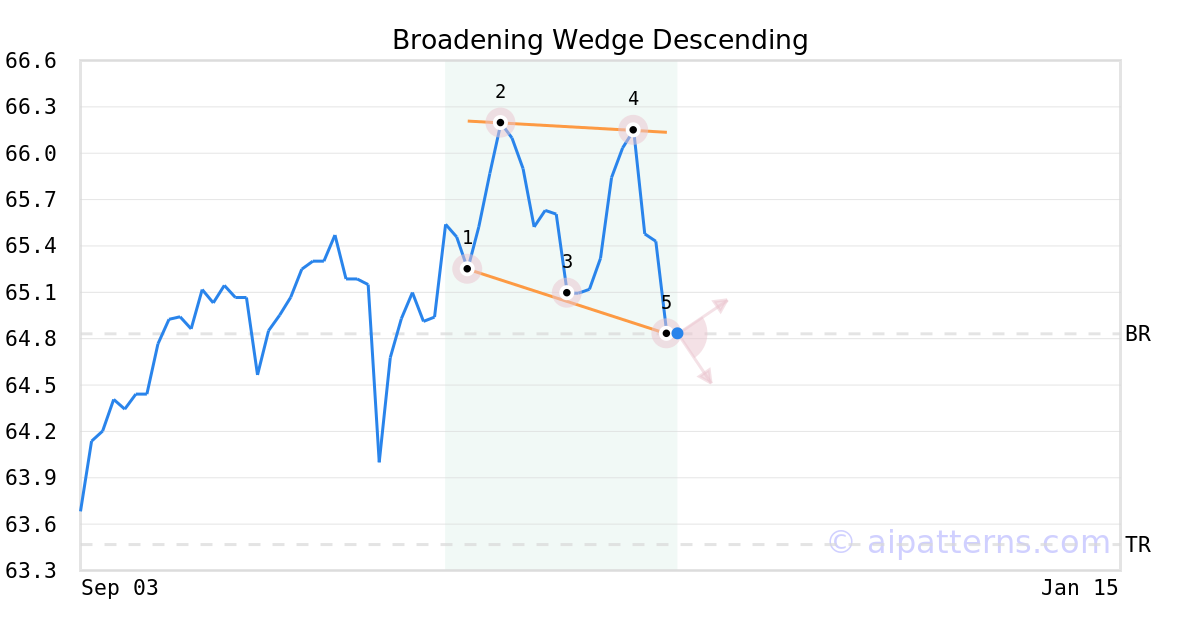
A.I.dvisor detected a bearish Broadening Wedge Descending pattern for AVMA stock. This pattern was detected on November 17, 2025 . The odds of reaching the target price are 6.
The Broadening Wedge Descending pattern forms when a security price makes lower lows (1, 3, 5) and lower highs (2, 4), forming two downward sloping lines that expand over time.
Consider selling the security short or buying a put option at the downward breakout price level, which is the last low touching the bottom line.
Momentum Indicator for AVMA turns negative, indicating new downward trend
AVMA saw its Momentum Indicator move below the 0 level on November 13, 2025. This is an indication that the stock could be shifting in to a new downward move. Traders may want to consider selling the stock or exploring put options. Tickeron's A.I.dvisor looked at 34 similar instances where the indicator turned negative. In of the 34 cases, the stock moved further down in the following days. The odds of a decline are at .

Technical Analysis (Indicators)
Bearish Trend Analysis
The Moving Average Convergence Divergence Histogram (MACD) for AVMA turned negative on November 13, 2025. This could be a sign that the stock is set to turn lower in the coming weeks. Traders may want to sell the stock or buy put options. Tickeron's A.I.dvisor looked at 27 similar instances when the indicator turned negative. In of the 27 cases the stock turned lower in the days that followed. This puts the odds of success at .
AVMA moved below its 50-day moving average on November 17, 2025 date and that indicates a change from an upward trend to a downward trend.
Following a 3-day decline, the stock is projected to fall further. Considering past instances where AVMA declined for three days, the price rose further in of 62 cases within the following month. The odds of a continued downward trend are .
Bullish Trend Analysis
The Stochastic Oscillator is in the oversold zone. Keep an eye out for a move up in the foreseeable future.
Following a 3-day Advance, the price is estimated to grow further. Considering data from situations where AVMA advanced for three days, in of 169 cases, the price rose further within the following month. The odds of a continued upward trend are .
Advertisement
General Information
Category ModerateAllocation