BAC Stock Tickeron detected bearish Stock Pattern: Wedge Rising BAC on November 04, 2025, netting in a 2.68% gain over 2 weeks


at Tickeron.com


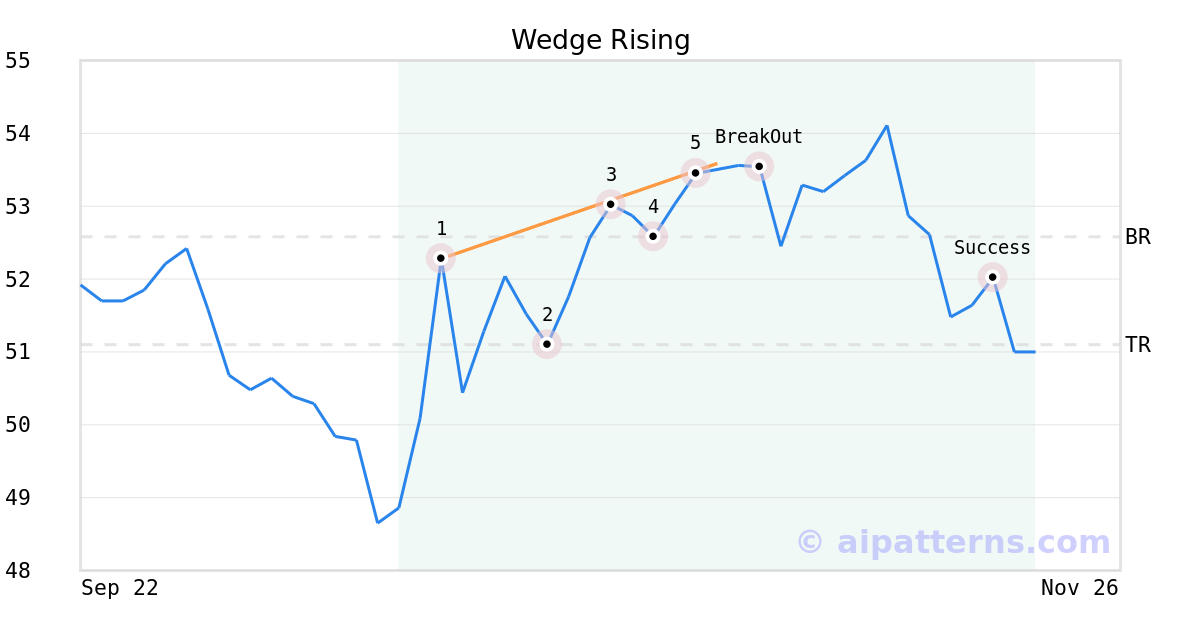
On October 31, 2025, A.I.dvisor detected a Wedge Rising Pattern (Bearish) for Bank of America Corp (BAC, $53.45). 4 days later, on November 04, 2025, A.I.dvisor confirmed the Bearish pattern, setting a target price of the stock. On November 19, 2025, the stock hit the target price of $51.10 – resulting in a gain for traders who shorted the stock on the pattern detection date.
BAC in -2.63% downward trend, sliding for three consecutive days on November 17, 2025
Moving lower for three straight days is viewed as a bearish sign. Keep an eye on this stock for future declines. Considering data from situations where BAC declined for three days, in of 313 cases, the price declined further within the following month. The odds of a continued downward trend are .

Technical Analysis (Indicators)
Bearish Trend Analysis
The Momentum Indicator moved below the 0 level on November 13, 2025. You may want to consider selling the stock, shorting the stock, or exploring put options on BAC as a result. In of 79 cases where the Momentum Indicator fell below 0, the stock fell further within the subsequent month. The odds of a continued downward trend are .
The Moving Average Convergence Divergence Histogram (MACD) for BAC turned negative on November 13, 2025. This could be a sign that the stock is set to turn lower in the coming weeks. Traders may want to sell the stock or buy put options. Tickeron's A.I.dvisor looked at 46 similar instances when the indicator turned negative. In of the 46 cases the stock turned lower in the days that followed. This puts the odds of success at .
BAC moved below its 50-day moving average on November 20, 2025 date and that indicates a change from an upward trend to a downward trend.
Bullish Trend Analysis
The Stochastic Oscillator shows that the ticker has stayed in the oversold zone for 3 days. The price of this ticker is presumed to bounce back soon, since the longer the ticker stays in the oversold zone, the more promptly an upward trend is expected.
Following a 3-day Advance, the price is estimated to grow further. Considering data from situations where BAC advanced for three days, in of 337 cases, the price rose further within the following month. The odds of a continued upward trend are .
BAC may jump back above the lower band and head toward the middle band. Traders may consider buying the stock or exploring call options.
The Aroon Indicator entered an Uptrend today. In of 301 cases where BAC Aroon's Indicator entered an Uptrend, the price rose further within the following month. The odds of a continued Uptrend are .
Fundamental Analysis (Ratings)
The Tickeron SMR rating for this company is (best 1 - 100 worst), indicating very strong sales and a profitable business model. SMR (Sales, Margin, Return on Equity) rating is based on comparative analysis of weighted Sales, Income Margin and Return on Equity values compared against S&P 500 index constituents. The weighted SMR value is a proprietary formula developed by Tickeron and represents an overall profitability measure for a stock.
The Tickeron Profit vs. Risk Rating rating for this company is (best 1 - 100 worst), indicating low risk on high returns. The average Profit vs. Risk Rating rating for the industry is 26, placing this stock worse than average.
The Tickeron Price Growth Rating for this company is (best 1 - 100 worst), indicating fairly steady price growth. BAC’s price grows at a lower rate over the last 12 months as compared to S&P 500 index constituents.
The Tickeron PE Growth Rating for this company is (best 1 - 100 worst), pointing to average earnings growth. The PE Growth rating is based on a comparative analysis of stock PE ratio increase over the last 12 months compared against S&P 500 index constituents.
The Tickeron Valuation Rating of (best 1 - 100 worst) indicates that the company is slightly overvalued in the industry. This rating compares market capitalization estimated by our proprietary formula with the current market capitalization. This rating is based on the following metrics, as compared to industry averages: P/B Ratio (1.339) is normal, around the industry mean (1.307). P/E Ratio (13.934) is within average values for comparable stocks, (12.030). Projected Growth (PEG Ratio) (0.977) is also within normal values, averaging (4.415). BAC has a moderately low Dividend Yield (0.021) as compared to the industry average of (0.041). P/S Ratio (3.687) is also within normal values, averaging (3.368).
Advertisement
General Information
a major bank
Industry MajorBanks