BBP Stock Tickeron detected bullish ETF Pattern: Three Rising Valleys BBP on November 10, 2025, netting in a 6.86% gain over 3 weeks


at Tickeron.com


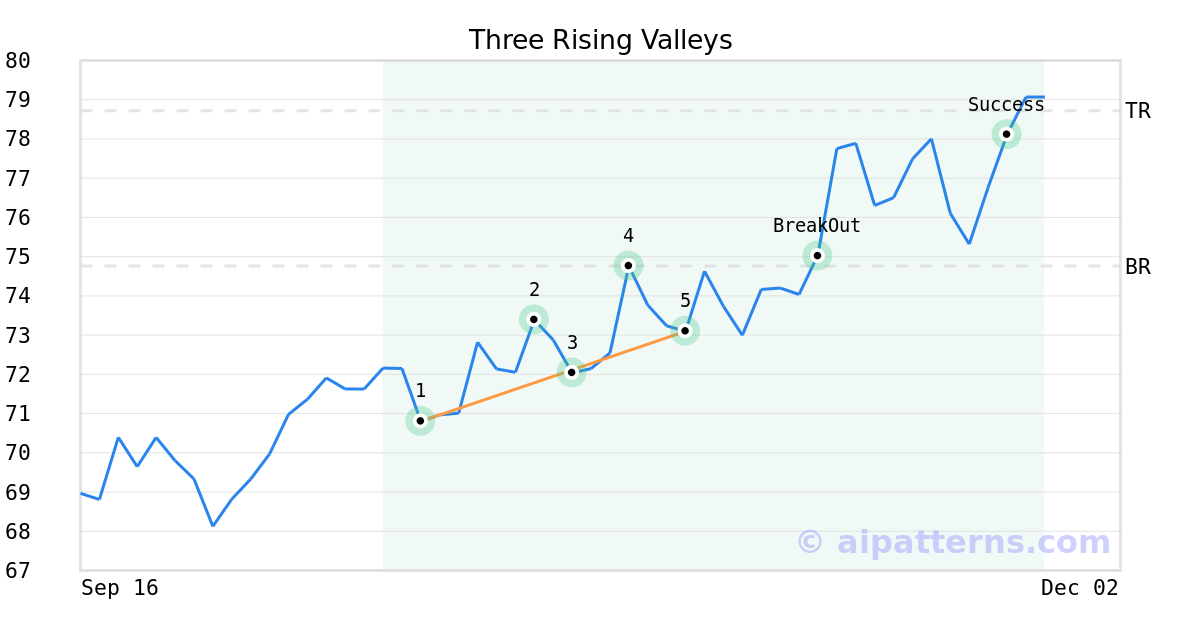
On October 30, 2025, A.I.dvisor detected a Three Rising Valleys Pattern (Bullish) for Virtus LifeSci Biotech Products ETF (BBP, $73.10). On November 10, 2025, A.I.dvisor confirmed the Bullish pattern, setting a target price of $78.72. 14 days later, on November 24, 2025, BBP reached the target price resulting in a for traders who took a long position in the stock.
BBP in +2.55% Uptrend, rising for three consecutive days on November 26, 2025
Moving higher for three straight days is viewed as a bullish sign. Keep an eye on this stock for future growth. Considering data from situations where BBP advanced for three days, in of 312 cases, the price rose further within the following month. The odds of a continued upward trend are .

Technical Analysis (Indicators)
Bullish Trend Analysis
The Moving Average Convergence Divergence (MACD) for BBP just turned positive on November 24, 2025. Looking at past instances where BBP's MACD turned positive, the stock continued to rise in of 53 cases over the following month. The odds of a continued upward trend are .
The Aroon Indicator entered an Uptrend today. In of 228 cases where BBP Aroon's Indicator entered an Uptrend, the price rose further within the following month. The odds of a continued Uptrend are .
Bearish Trend Analysis
The 10-day RSI Indicator for BBP moved out of overbought territory on December 01, 2025. This could be a bearish sign for the stock. Traders may want to consider selling the stock or buying put options. Tickeron's A.I.dvisor looked at 30 similar instances where the indicator moved out of overbought territory. In of the 30 cases, the stock moved lower in the following days. This puts the odds of a move lower at .
The Stochastic Oscillator demonstrated that the ticker has stayed in the overbought zone for 3 days. The longer the ticker stays in the overbought zone, the sooner a price pull-back is expected.
Following a 3-day decline, the stock is projected to fall further. Considering past instances where BBP declined for three days, the price rose further in of 62 cases within the following month. The odds of a continued downward trend are .
BBP broke above its upper Bollinger Band on November 11, 2025. This could be a sign that the stock is set to drop as the stock moves back below the upper band and toward the middle band. You may want to consider selling the stock or exploring put options.
Advertisement
General Information
Category Health