BCI Stock Tickeron detected bullish ETF Pattern: Triangle Symmetrical Bottom BCI on November 03, 2025, netting in a 3.92% gain over 1 month


at Tickeron.com


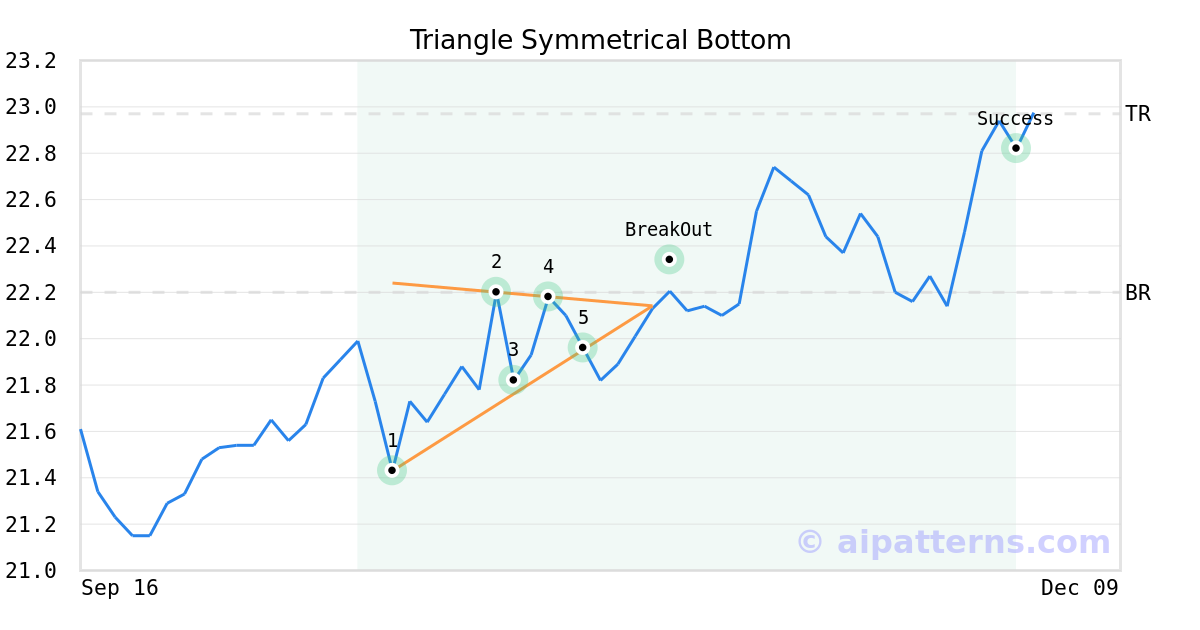
On October 27, 2025, A.I.dvisor detected a Triangle Symmetrical Bottom Pattern (Bullish) for abrdn Blmb AllCmdStrK1Fr ETF (BCI, $21.96). On November 03, 2025, A.I.dvisor confirmed the Bullish pattern, setting a target price of $22.97. 29 days later, on December 02, 2025, BCI reached the target price resulting in a for traders who took a long position in the stock.
Momentum Indicator for BCI turns positive, indicating new upward trend
BCI saw its Momentum Indicator move above the 0 level on November 28, 2025. This is an indication that the stock could be shifting in to a new upward move. Traders may want to consider buying the stock or buying call options. Tickeron's A.I.dvisor looked at 87 similar instances where the indicator turned positive. In of the 87 cases, the stock moved higher in the following days. The odds of a move higher are at .

Technical Analysis (Indicators)
Bullish Trend Analysis
The Moving Average Convergence Divergence (MACD) for BCI just turned positive on December 01, 2025. Looking at past instances where BCI's MACD turned positive, the stock continued to rise in of 50 cases over the following month. The odds of a continued upward trend are .
Following a 3-day Advance, the price is estimated to grow further. Considering data from situations where BCI advanced for three days, in of 360 cases, the price rose further within the following month. The odds of a continued upward trend are .
The Aroon Indicator entered an Uptrend today. In of 262 cases where BCI Aroon's Indicator entered an Uptrend, the price rose further within the following month. The odds of a continued Uptrend are .
Bearish Trend Analysis
The 10-day RSI Indicator for BCI moved out of overbought territory on November 12, 2025. This could be a bearish sign for the stock. Traders may want to consider selling the stock or buying put options. Tickeron's A.I.dvisor looked at 36 similar instances where the indicator moved out of overbought territory. In of the 36 cases, the stock moved lower in the following days. This puts the odds of a move lower at .
The Stochastic Oscillator has been in the overbought zone for 1 day. Expect a price pull-back in the near future.
Following a 3-day decline, the stock is projected to fall further. Considering past instances where BCI declined for three days, the price rose further in of 62 cases within the following month. The odds of a continued downward trend are .
BCI broke above its upper Bollinger Band on November 10, 2025. This could be a sign that the stock is set to drop as the stock moves back below the upper band and toward the middle band. You may want to consider selling the stock or exploring put options.
Advertisement
General Information
Category CommoditiesBroadBasket