BTC.X Crypto Tickeron detected bearish Crypto Pattern: Triangle Symmetrical Top BTC.X on November 02, 2025, netting in a 17.33% gain over 2 weeks


at Tickeron.com


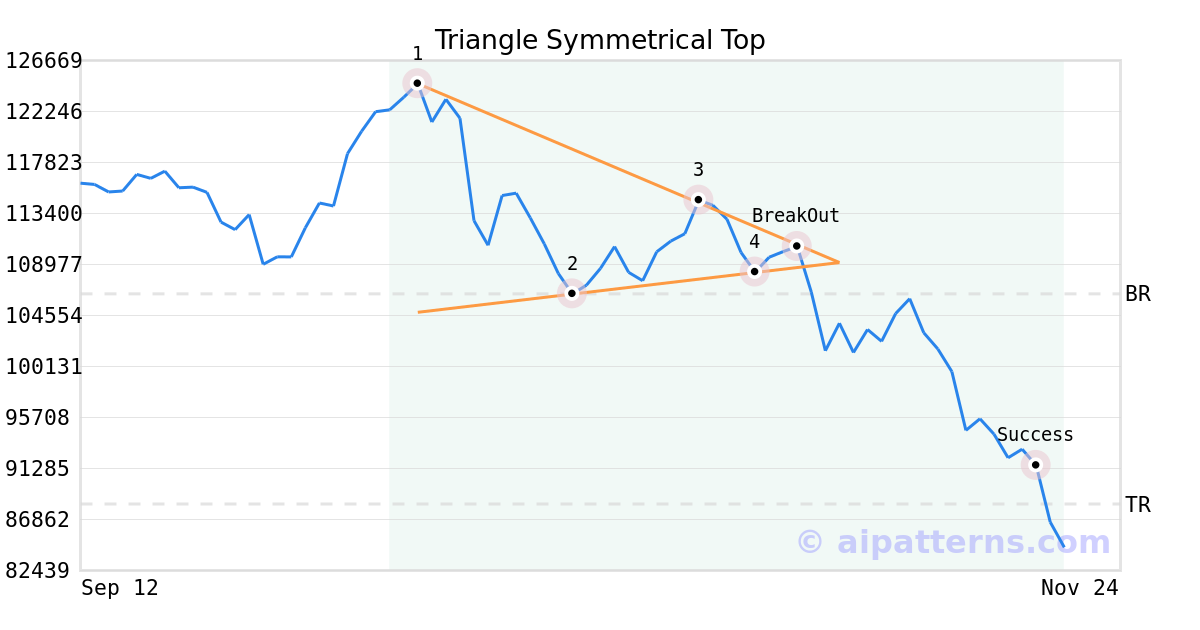
On November 02, 2025, A.I.dvisor detected a Triangle Symmetrical Top Pattern (Bearish) for Bitcoin cryptocurrency (BTC.X, $110639.600000). On November 02, 2025, A.I.dvisor confirmed the Bearish pattern, setting a target price of the stock. On November 19, 2025, the stock hit the target price of $88204.820000 – resulting in a +1 gain for traders who shorted the stock on the pattern detection date.
BTC.X sees its 50-day moving average cross bearishly below its 200-day moving average
The 50-day moving average for BTC.X moved below the 200-day moving average on November 16, 2025. This could be a long-term bearish signal for the stock as the stock shifts to an downward trend.

Technical Analysis (Indicators)
Bearish Trend Analysis
The Stochastic Oscillator may be shifting from an upward trend to a downward trend. In of 92 cases where BTC.X's Stochastic Oscillator exited the overbought zone, the price fell further within the following month. The odds of a continued downward trend are .
BTC.X moved below its 50-day moving average on October 27, 2025 date and that indicates a change from an upward trend to a downward trend.
Following a 3-day decline, the stock is projected to fall further. Considering past instances where BTC.X declined for three days, the price rose further in of 62 cases within the following month. The odds of a continued downward trend are .
The Aroon Indicator for BTC.X entered a downward trend on November 28, 2025. This could indicate a strong downward move is ahead for the stock. Traders may want to consider selling the stock or buying put options.
Bullish Trend Analysis
The RSI Indicator points to a transition from a downward trend to an upward trend -- in cases where BTC.X's RSI Indicator exited the oversold zone, of 31 resulted in an increase in price. Tickeron's analysis proposes that the odds of a continued upward trend are .
The Momentum Indicator moved above the 0 level on November 30, 2025. You may want to consider a long position or call options on BTC.X as a result. In of 140 past instances where the momentum indicator moved above 0, the stock continued to climb. The odds of a continued upward trend are .
The Moving Average Convergence Divergence (MACD) for BTC.X just turned positive on November 27, 2025. Looking at past instances where BTC.X's MACD turned positive, the stock continued to rise in of 67 cases over the following month. The odds of a continued upward trend are .
Following a 3-day Advance, the price is estimated to grow further. Considering data from situations where BTC.X advanced for three days, in of 435 cases, the price rose further within the following month. The odds of a continued upward trend are .
BTC.X may jump back above the lower band and head toward the middle band. Traders may consider buying the stock or exploring call options.
Advertisement