BWG Stock Tickeron detected bearish ETF Pattern: Broadening Wedge Descending on October 17, 2025


at Tickeron.com


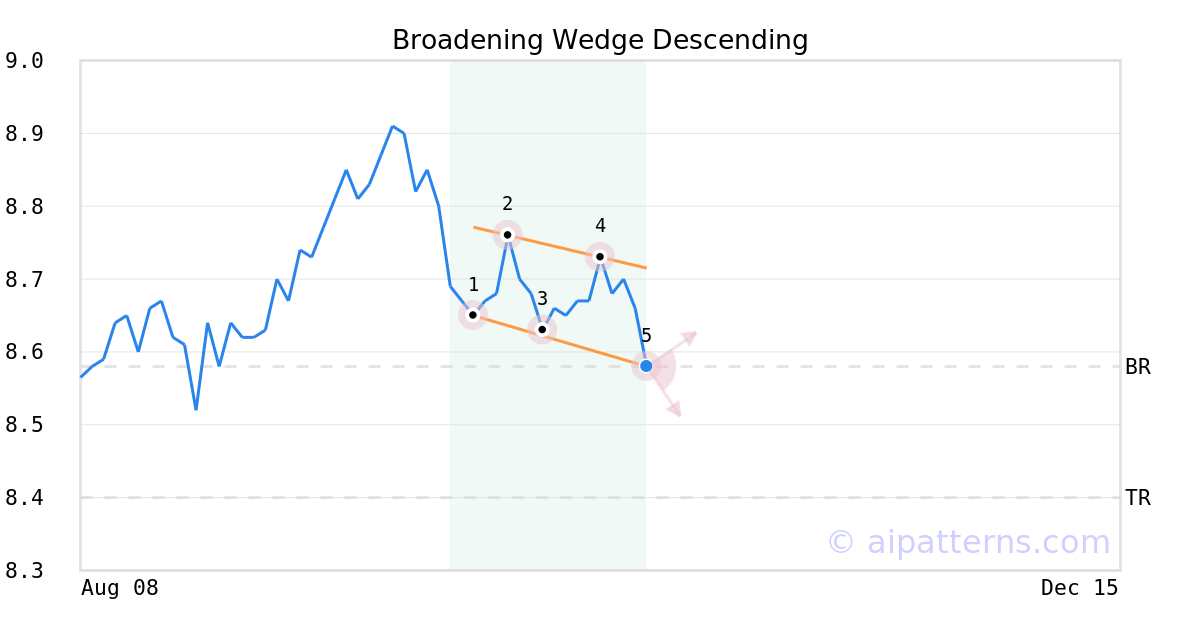
A.I.dvisor detected a bearish Broadening Wedge Descending pattern for BWG stock. This pattern was detected on October 17, 2025 . The odds of reaching the target price are 6.
The Broadening Wedge Descending pattern forms when a security price makes lower lows (1, 3, 5) and lower highs (2, 4), forming two downward sloping lines that expand over time.
Consider selling the security short or buying a put option at the downward breakout price level, which is the last low touching the bottom line.
BWG in downward trend: price dove below 50-day moving average on October 29, 2025
BWG moved below its 50-day moving average on October 29, 2025 date and that indicates a change from an upward trend to a downward trend. In of 38 similar past instances, the stock price decreased further within the following month. The odds of a continued downward trend are .

Technical Analysis (Indicators)
Bearish Trend Analysis
The Momentum Indicator moved below the 0 level on October 27, 2025. You may want to consider selling the stock, shorting the stock, or exploring put options on BWG as a result. In of 80 cases where the Momentum Indicator fell below 0, the stock fell further within the subsequent month. The odds of a continued downward trend are .
The 10-day moving average for BWG crossed bearishly below the 50-day moving average on October 29, 2025. This indicates that the trend has shifted lower and could be considered a sell signal. In of 12 past instances when the 10-day crossed below the 50-day, the stock continued to move higher over the following month. The odds of a continued downward trend are .
Following a 3-day decline, the stock is projected to fall further. Considering past instances where BWG declined for three days, the price rose further in of 62 cases within the following month. The odds of a continued downward trend are .
The Aroon Indicator for BWG entered a downward trend on November 18, 2025. This could indicate a strong downward move is ahead for the stock. Traders may want to consider selling the stock or buying put options.
Bullish Trend Analysis
The RSI Indicator points to a transition from a downward trend to an upward trend -- in cases where BWG's RSI Indicator exited the oversold zone, of 33 resulted in an increase in price. Tickeron's analysis proposes that the odds of a continued upward trend are .
The Stochastic Oscillator suggests the stock price trend may be in a reversal from a downward trend to an upward trend. of 50 cases where BWG's Stochastic Oscillator exited the oversold zone resulted in an increase in price. Tickeron's analysis proposes that the odds of a continued upward trend are .
Following a 3-day Advance, the price is estimated to grow further. Considering data from situations where BWG advanced for three days, in of 324 cases, the price rose further within the following month. The odds of a continued upward trend are .
BWG may jump back above the lower band and head toward the middle band. Traders may consider buying the stock or exploring call options.
Advertisement
General Information
Category Unknown