CAH Stock Tickeron detected bullish Stock Pattern: Flag CAH on October 20, 2025, netting in a 7.31% gain over 1 week


at Tickeron.com


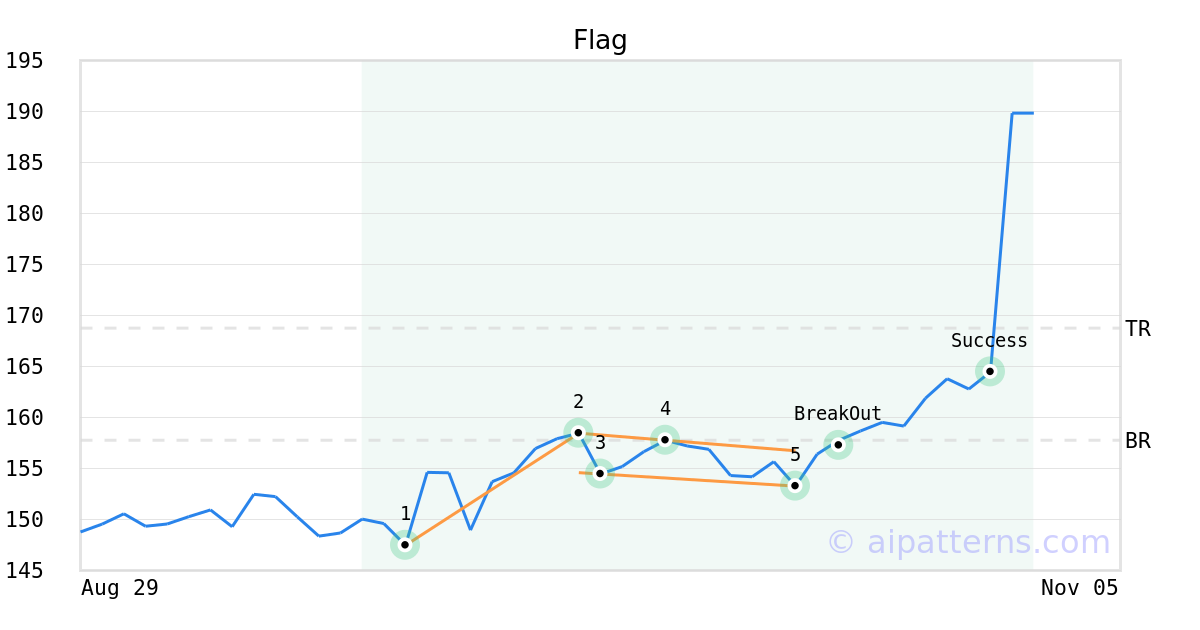
On October 16, 2025, A.I.dvisor detected a Flag Pattern (Bullish) for Cardinal Health (CAH, $153.27). On October 20, 2025, A.I.dvisor confirmed the Bullish pattern, setting a target price of $168.76. 9 days later, on October 29, 2025, CAH reached the target price resulting in a for traders who took a long position in the stock.
CAH in +2.03% Uptrend, advancing for three consecutive days on November 25, 2025
Moving higher for three straight days is viewed as a bullish sign. Keep an eye on this stock for future growth. Considering data from situations where CAH advanced for three days, in of 368 cases, the price rose further within the following month. The odds of a continued upward trend are .

Technical Analysis (Indicators)
Bullish Trend Analysis
The Aroon Indicator entered an Uptrend today. In of 266 cases where CAH Aroon's Indicator entered an Uptrend, the price rose further within the following month. The odds of a continued Uptrend are .
Bearish Trend Analysis
The RSI Indicator demonstrates that the ticker has stayed in the overbought zone for 19 days. The longer the ticker stays in the overbought zone, the sooner a price pull-back is expected.
The Stochastic Oscillator demonstrated that the ticker has stayed in the overbought zone for 22 days. The longer the ticker stays in the overbought zone, the sooner a price pull-back is expected.
The Moving Average Convergence Divergence Histogram (MACD) for CAH turned negative on November 21, 2025. This could be a sign that the stock is set to turn lower in the coming weeks. Traders may want to sell the stock or buy put options. Tickeron's A.I.dvisor looked at 38 similar instances when the indicator turned negative. In of the 38 cases the stock turned lower in the days that followed. This puts the odds of success at .
Following a 3-day decline, the stock is projected to fall further. Considering past instances where CAH declined for three days, the price rose further in of 62 cases within the following month. The odds of a continued downward trend are .
CAH broke above its upper Bollinger Band on November 25, 2025. This could be a sign that the stock is set to drop as the stock moves back below the upper band and toward the middle band. You may want to consider selling the stock or exploring put options.
Fundamental Analysis (Ratings)
The Tickeron Profit vs. Risk Rating rating for this company is (best 1 - 100 worst), indicating low risk on high returns. The average Profit vs. Risk Rating rating for the industry is 81, placing this stock better than average.
The Tickeron Price Growth Rating for this company is (best 1 - 100 worst), indicating outstanding price growth. CAH’s price grows at a higher rate over the last 12 months as compared to S&P 500 index constituents.
The Tickeron PE Growth Rating for this company is (best 1 - 100 worst), pointing to outstanding earnings growth. The PE Growth rating is based on a comparative analysis of stock PE ratio increase over the last 12 months compared against S&P 500 index constituents.
The Tickeron Valuation Rating of (best 1 - 100 worst) indicates that the company is slightly overvalued in the industry. This rating compares market capitalization estimated by our proprietary formula with the current market capitalization. This rating is based on the following metrics, as compared to industry averages: P/B Ratio (0.000) is normal, around the industry mean (9.406). P/E Ratio (32.237) is within average values for comparable stocks, (31.142). Projected Growth (PEG Ratio) (2.032) is also within normal values, averaging (2.644). Dividend Yield (0.009) settles around the average of (0.028) among similar stocks. P/S Ratio (0.219) is also within normal values, averaging (141.710).
The Tickeron SMR rating for this company is (best 1 - 100 worst), indicating weak sales and an unprofitable business model. SMR (Sales, Margin, Return on Equity) rating is based on comparative analysis of weighted Sales, Income Margin and Return on Equity values compared against S&P 500 index constituents. The weighted SMR value is a proprietary formula developed by Tickeron and represents an overall profitability measure for a stock.
Advertisement
General Information
a maker of pharmaceuticals, medical, surgical and laboratory supplies as well as develops drug delivery systems
Industry MedicalDistributors