CANE Stock Tickeron detected bullish ETF Pattern: Head-and-Shoulders Bottom CANE on November 13, 2025, netting in a 0.00% gain over 0 days


at Tickeron.com


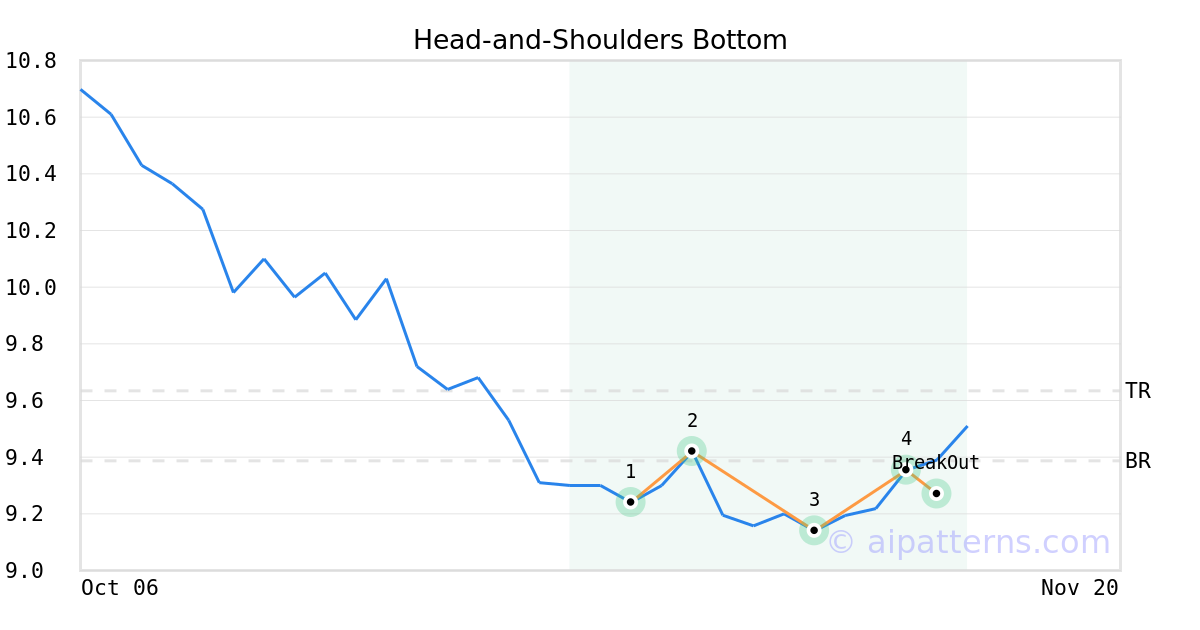
On November 13, 2025, A.I.dvisor detected a Head-and-Shoulders Bottom Pattern (Bullish) for Teucrium Sugar Fund (CANE, $9.27). On November 13, 2025, A.I.dvisor confirmed the Bullish pattern, setting a target price of $9.63. On November 13, 2025, CANE reached the target price resulting in a for traders who took a long position in the stock.
Momentum Indicator for CANE turns positive, indicating new upward trend
CANE saw its Momentum Indicator move above the 0 level on November 12, 2025. This is an indication that the stock could be shifting in to a new upward move. Traders may want to consider buying the stock or buying call options. Tickeron's A.I.dvisor looked at 103 similar instances where the indicator turned positive. In of the 103 cases, the stock moved higher in the following days. The odds of a move higher are at .

Technical Analysis (Indicators)
Bullish Trend Analysis
The RSI Oscillator points to a transition from a downward trend to an upward trend -- in cases where CANE's RSI Indicator exited the oversold zone, of 20 resulted in an increase in price. Tickeron's analysis proposes that the odds of a continued upward trend are .
The Moving Average Convergence Divergence (MACD) for CANE just turned positive on November 11, 2025. Looking at past instances where CANE's MACD turned positive, the stock continued to rise in of 54 cases over the following month. The odds of a continued upward trend are .
Following a 3-day Advance, the price is estimated to grow further. Considering data from situations where CANE advanced for three days, in of 295 cases, the price rose further within the following month. The odds of a continued upward trend are .
Bearish Trend Analysis
The Stochastic Oscillator entered the overbought zone. Expect a price pull-back in the foreseeable future.
Following a 3-day decline, the stock is projected to fall further. Considering past instances where CANE declined for three days, the price rose further in of 62 cases within the following month. The odds of a continued downward trend are .
CANE broke above its upper Bollinger Band on November 14, 2025. This could be a sign that the stock is set to drop as the stock moves back below the upper band and toward the middle band. You may want to consider selling the stock or exploring put options.
The Aroon Indicator for CANE entered a downward trend on November 18, 2025. This could indicate a strong downward move is ahead for the stock. Traders may want to consider selling the stock or buying put options.
Advertisement
General Information
Category CommoditiesBroadBasket