CCD Stock Tickeron detected bearish ETF Pattern: Triple Tops CCD on November 12, 2025, netting in a 2.79% gain over 2 days


at Tickeron.com


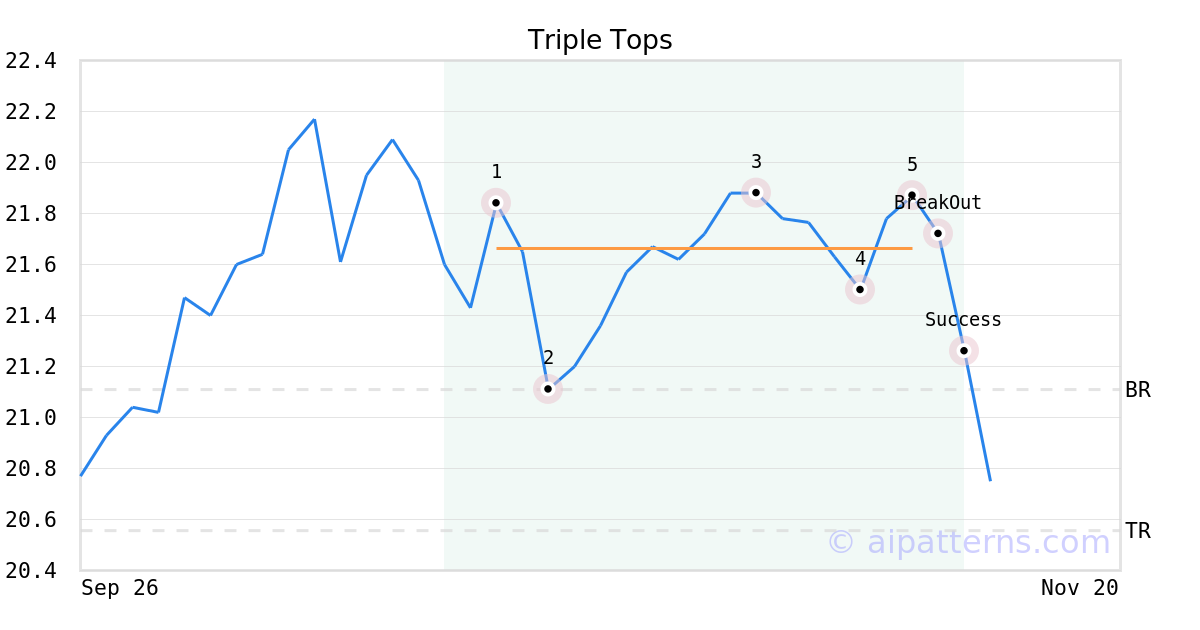
On November 11, 2025, A.I.dvisor detected a Triple Tops Pattern (Bearish) for Calamos Dynamic Convertible & Income Fund (CCD, $21.67). 1 day later, on November 12, 2025, A.I.dvisor confirmed the Bearish pattern, setting a target price of the stock. On November 13, 2025, the stock hit the target price of $20.56 – resulting in a gain for traders who shorted the stock on the pattern detection date.
CCD in -1.45% downward trend, sliding for three consecutive days on November 18, 2025
Moving lower for three straight days is viewed as a bearish sign. Keep an eye on this stock for future declines. Considering data from situations where CCD declined for three days, in of 300 cases, the price declined further within the following month. The odds of a continued downward trend are .

Technical Analysis (Indicators)
Bearish Trend Analysis
The Momentum Indicator moved below the 0 level on November 13, 2025. You may want to consider selling the stock, shorting the stock, or exploring put options on CCD as a result. In of 77 cases where the Momentum Indicator fell below 0, the stock fell further within the subsequent month. The odds of a continued downward trend are .
The Moving Average Convergence Divergence Histogram (MACD) for CCD turned negative on October 17, 2025. This could be a sign that the stock is set to turn lower in the coming weeks. Traders may want to sell the stock or buy put options. Tickeron's A.I.dvisor looked at 41 similar instances when the indicator turned negative. In of the 41 cases the stock turned lower in the days that followed. This puts the odds of success at .
CCD moved below its 50-day moving average on November 13, 2025 date and that indicates a change from an upward trend to a downward trend.
The Aroon Indicator for CCD entered a downward trend on November 18, 2025. This could indicate a strong downward move is ahead for the stock. Traders may want to consider selling the stock or buying put options.
Bullish Trend Analysis
The RSI Indicator demonstrates that the ticker has stayed in the oversold zone for 1 day, which means it's wise to expect a price bounce in the near future.
The Stochastic Oscillator demonstrated that the ticker has stayed in the oversold zone for 2 days, which means it's wise to expect a price bounce in the near future.
The 50-day moving average for CCD moved above the 200-day moving average on October 14, 2025. This could be a long-term bullish signal for the stock as the stock shifts to an upward trend.
Following a 3-day Advance, the price is estimated to grow further. Considering data from situations where CCD advanced for three days, in of 387 cases, the price rose further within the following month. The odds of a continued upward trend are .
CCD may jump back above the lower band and head toward the middle band. Traders may consider buying the stock or exploring call options.
Advertisement
General Information
Category Unknown