CGDV Stock Tickeron detected bullish ETF Pattern: Broadening Top on November 26, 2025


at Tickeron.com


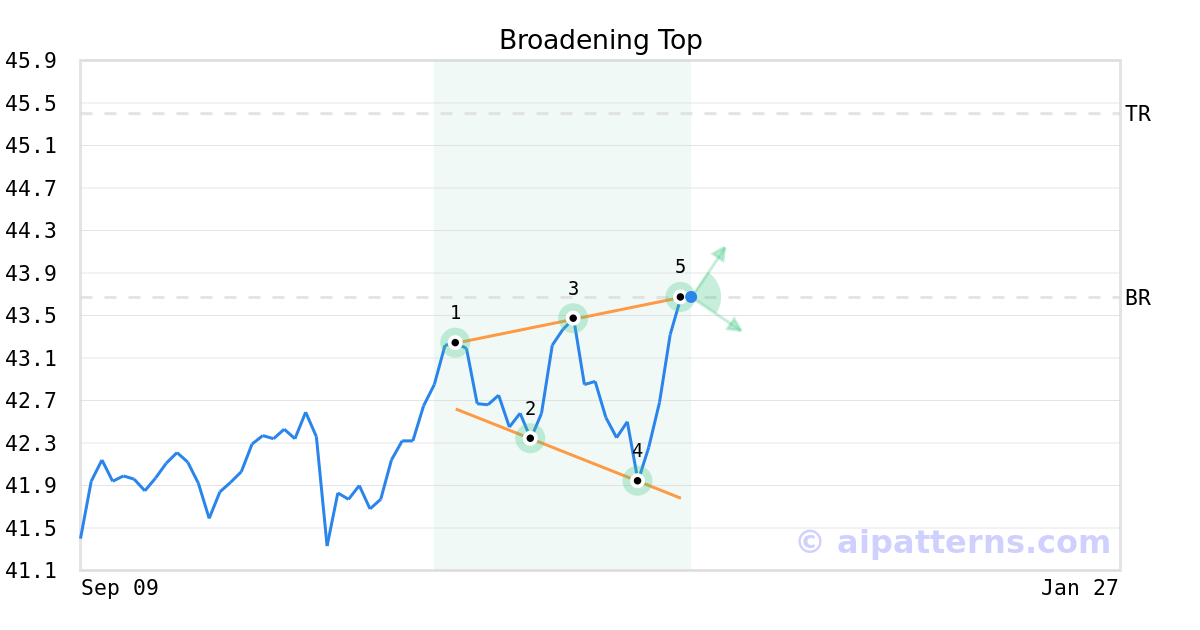
A.I.dvisor detected a bullish Broadening Top pattern for CGDV stock. This pattern was detected on November 26, 2025 . The odds of reaching the target price are 6.
The Broadening Top pattern forms when the price of a security progressively makes higher highs (1, 3) and lower lows (2, 4) following two widening trend lines.
Consider buying a security or call option at the upward breakout price/entry point.
Aroon Indicator for CGDV shows an upward move is likely
CGDV's Aroon Indicator triggered a bullish signal on November 21, 2025. Tickeron's A.I.dvisor detected that the AroonUp green line is above 70 while the AroonDown red line is below 30. When the up indicator moves above 70 and the down indicator remains below 30, it is a sign that the stock could be setting up for a bullish move. Traders may want to buy the stock or look to buy calls options. A.I.dvisor looked at 326 similar instances where the Aroon Indicator showed a similar pattern. In of the 326 cases, the stock moved higher in the days that followed. This puts the odds of a move higher at .

Technical Analysis (Indicators)
Bullish Trend Analysis
The Momentum Indicator moved above the 0 level on November 26, 2025. You may want to consider a long position or call options on CGDV as a result. In of 56 past instances where the momentum indicator moved above 0, the stock continued to climb. The odds of a continued upward trend are .
The Moving Average Convergence Divergence (MACD) for CGDV just turned positive on November 26, 2025. Looking at past instances where CGDV's MACD turned positive, the stock continued to rise in of 38 cases over the following month. The odds of a continued upward trend are .
CGDV moved above its 50-day moving average on November 24, 2025 date and that indicates a change from a downward trend to an upward trend.
Following a 3-day Advance, the price is estimated to grow further. Considering data from situations where CGDV advanced for three days, in of 257 cases, the price rose further within the following month. The odds of a continued upward trend are .
Bearish Trend Analysis
The 10-day RSI Indicator for CGDV moved out of overbought territory on October 30, 2025. This could be a bearish sign for the stock. Traders may want to consider selling the stock or buying put options. Tickeron's A.I.dvisor looked at 34 similar instances where the indicator moved out of overbought territory. In of the 34 cases, the stock moved lower in the following days. This puts the odds of a move lower at .
The Stochastic Oscillator demonstrated that the ticker has stayed in the overbought zone for 3 days. The longer the ticker stays in the overbought zone, the sooner a price pull-back is expected.
Following a 3-day decline, the stock is projected to fall further. Considering past instances where CGDV declined for three days, the price rose further in of 62 cases within the following month. The odds of a continued downward trend are .
Advertisement
General Information
Category LargeValue