CHESS.X Crypto Tickeron detected bearish Crypto Pattern: Three Falling Peaks on October 24, 2025


at Tickeron.com


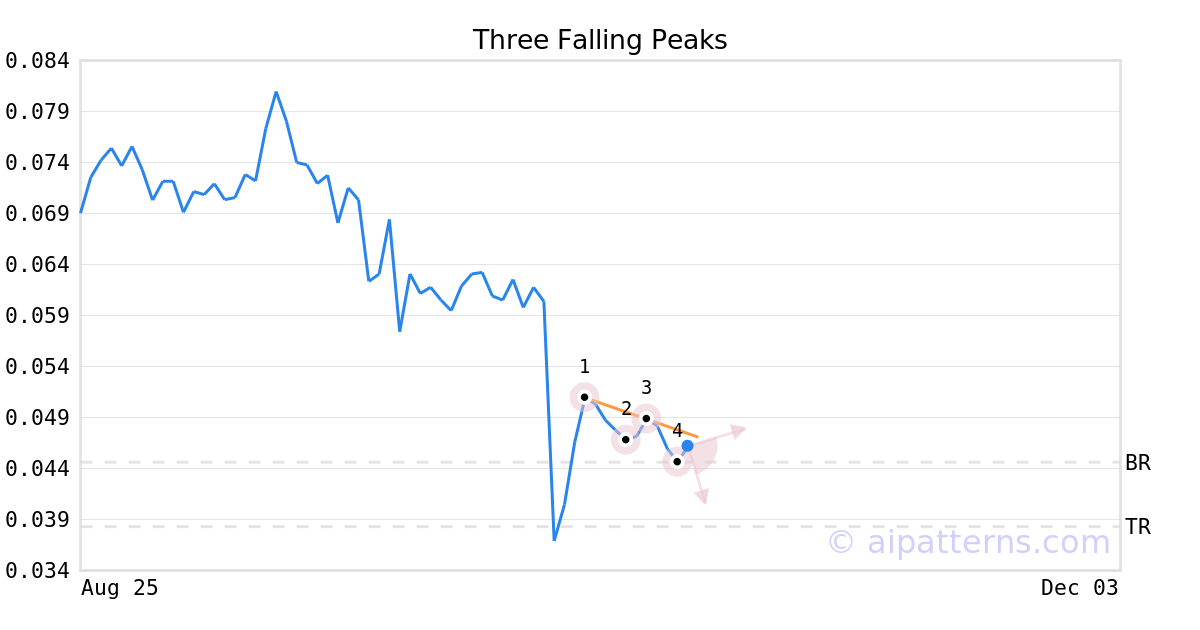
A.I.dvisor detected a bearish Three Falling Peaks pattern for CHESS.X stock. This pattern was detected on October 24, 2025 . The odds of reaching the target price are 8.
The Three Falling Peaks pattern forms when three minor Highs (1, 3, 5) arrange along a downward-sloping trend line.
Consider selling the security short or buying a put option at the downward breakout price level. When trading, wait for the confirmation move, which is when the price moves below the breakout level.
Momentum Indicator for CHESS.X turns negative, indicating new downward trend
CHESS.X saw its Momentum Indicator move below the 0 level on November 11, 2025. This is an indication that the stock could be shifting in to a new downward move. Traders may want to consider selling the stock or exploring put options. Tickeron's A.I.dvisor looked at 78 similar instances where the indicator turned negative. In of the 78 cases, the stock moved further down in the following days. The odds of a decline are at .

Technical Analysis (Indicators)
Bearish Trend Analysis
The Moving Average Convergence Divergence Histogram (MACD) for CHESS.X turned negative on November 16, 2025. This could be a sign that the stock is set to turn lower in the coming weeks. Traders may want to sell the stock or buy put options. Tickeron's A.I.dvisor looked at 40 similar instances when the indicator turned negative. In of the 40 cases the stock turned lower in the days that followed. This puts the odds of success at .
Following a 3-day decline, the stock is projected to fall further. Considering past instances where CHESS.X declined for three days, the price rose further in of 62 cases within the following month. The odds of a continued downward trend are .
The Aroon Indicator for CHESS.X entered a downward trend on November 19, 2025. This could indicate a strong downward move is ahead for the stock. Traders may want to consider selling the stock or buying put options.
Bullish Trend Analysis
The Stochastic Oscillator shows that the ticker has stayed in the oversold zone for 6 days. The price of this ticker is presumed to bounce back soon, since the longer the ticker stays in the oversold zone, the more promptly an upward trend is expected.
Following a 3-day Advance, the price is estimated to grow further. Considering data from situations where CHESS.X advanced for three days, in of 272 cases, the price rose further within the following month. The odds of a continued upward trend are .
CHESS.X may jump back above the lower band and head toward the middle band. Traders may consider buying the stock or exploring call options.