CMCI Stock Tickeron detected bullish ETF Pattern: Broadening Bottom on November 13, 2024


at Tickeron.com


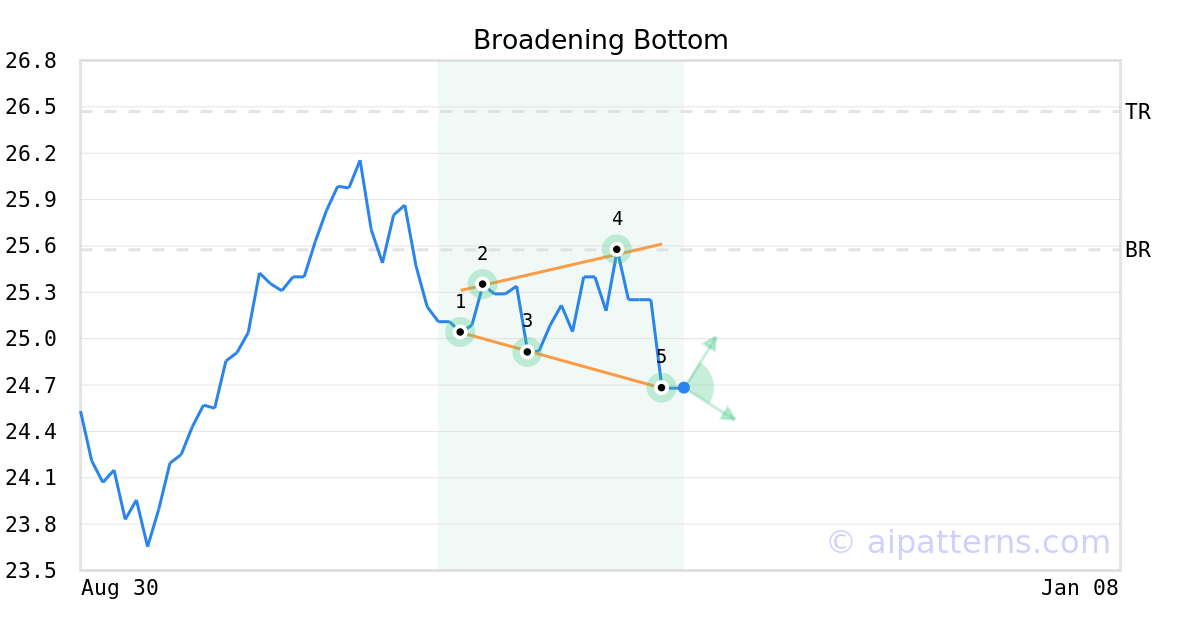
A.I.dvisor detected a bullish Broadening Bottom pattern for CMCI stock. This pattern was detected on November 13, 2024 . The odds of reaching the target price are 6.
The Broadening Bottom pattern is formed when the price of a security progressively makes higher highs (2, 4) and lower lows (1, 3, 5) following two widening trend lines.
Consider buying a security or call option at the upward breakout price/entry point.
CMCI in upward trend: price rose above 50-day moving average on November 04, 2025
CMCI moved above its 50-day moving average on November 04, 2025 date and that indicates a change from a downward trend to an upward trend. In of 14 similar past instances, the stock price increased further within the following month. The odds of a continued upward trend are .

Technical Analysis (Indicators)
Bullish Trend Analysis
The 10-day moving average for CMCI crossed bullishly above the 50-day moving average on November 05, 2025. This indicates that the trend has shifted higher and could be considered a buy signal. In of 5 past instances when the 10-day crossed above the 50-day, the stock continued to move higher over the following month. The odds of a continued upward trend are .
Bearish Trend Analysis
The RSI Indicator demonstrates that the ticker has stayed in the overbought zone for 16 days. The longer the ticker stays in the overbought zone, the sooner a price pull-back is expected.
The Stochastic Oscillator may be shifting from an upward trend to a downward trend. In of 25 cases where CMCI's Stochastic Oscillator exited the overbought zone, the price fell further within the following month. The odds of a continued downward trend are .
The Momentum Indicator moved below the 0 level on November 26, 2025. You may want to consider selling the stock, shorting the stock, or exploring put options on CMCI as a result. In of 35 cases where the Momentum Indicator fell below 0, the stock fell further within the subsequent month. The odds of a continued downward trend are .
The Moving Average Convergence Divergence Histogram (MACD) for CMCI turned negative on November 25, 2025. This could be a sign that the stock is set to turn lower in the coming weeks. Traders may want to sell the stock or buy put options. Tickeron's A.I.dvisor looked at 21 similar instances when the indicator turned negative. In of the 21 cases the stock turned lower in the days that followed. This puts the odds of success at .
CMCI broke above its upper Bollinger Band on November 04, 2025. This could be a sign that the stock is set to drop as the stock moves back below the upper band and toward the middle band. You may want to consider selling the stock or exploring put options.
Advertisement
General Information
Category CommoditiesBroadBasket