CMCL Stock Tickeron detected bearish Stock Pattern: Broadening Top CMCL on October 16, 2025, netting in a 14.13% gain over 6 days


at Tickeron.com


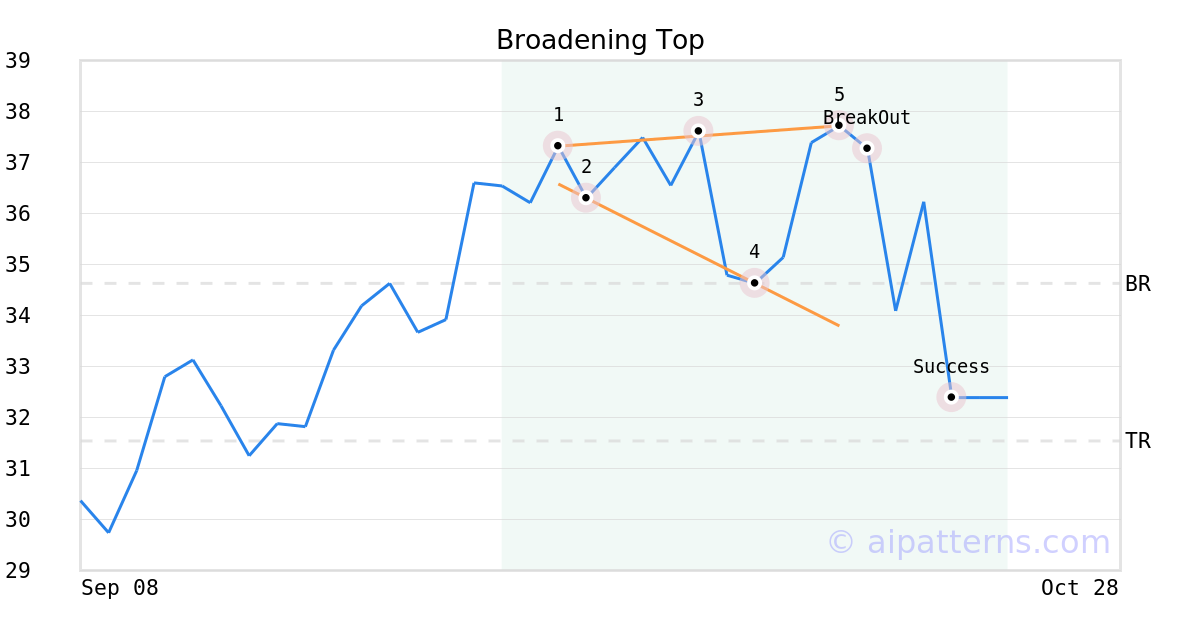
On October 15, 2025, A.I.dvisor detected a Broadening Top Pattern (Bearish) for Caledonia Mining Corp (CMCL, $37.72). 1 day later, on October 16, 2025, A.I.dvisor confirmed the Bearish pattern, setting a target price of the stock. On October 21, 2025, the stock hit the target price of $31.54 – resulting in a +1 gain for traders who shorted the stock on the pattern detection date.
CMCL's Indicator enters downward trend
The Aroon Indicator for CMCL entered a downward trend on November 14, 2025. Tickeron's A.I.dvisor identified a pattern where the AroonDown red line was above 70 while the AroonUp green line was below 30 for three straight days. This could indicate a strong downward move is ahead for the stock. Traders may want to consider selling the stock or buying put options. A.I.dvisor looked at 202 similar instances where the Aroon Indicator formed such a pattern. In of the 202 cases the stock moved lower. This puts the odds of a downward move at .

Technical Analysis (Indicators)
Bearish Trend Analysis
The Momentum Indicator moved below the 0 level on November 21, 2025. You may want to consider selling the stock, shorting the stock, or exploring put options on CMCL as a result. In of 93 cases where the Momentum Indicator fell below 0, the stock fell further within the subsequent month. The odds of a continued downward trend are .
CMCL moved below its 50-day moving average on October 27, 2025 date and that indicates a change from an upward trend to a downward trend.
The 10-day moving average for CMCL crossed bearishly below the 50-day moving average on October 30, 2025. This indicates that the trend has shifted lower and could be considered a sell signal. In of 11 past instances when the 10-day crossed below the 50-day, the stock continued to move higher over the following month. The odds of a continued downward trend are .
Following a 3-day decline, the stock is projected to fall further. Considering past instances where CMCL declined for three days, the price rose further in of 62 cases within the following month. The odds of a continued downward trend are .
Bullish Trend Analysis
The RSI Indicator points to a transition from a downward trend to an upward trend -- in cases where CMCL's RSI Oscillator exited the oversold zone, of 17 resulted in an increase in price. Tickeron's analysis proposes that the odds of a continued upward trend are .
The Stochastic Oscillator is in the oversold zone. Keep an eye out for a move up in the foreseeable future.
The Moving Average Convergence Divergence (MACD) for CMCL just turned positive on November 13, 2025. Looking at past instances where CMCL's MACD turned positive, the stock continued to rise in of 52 cases over the following month. The odds of a continued upward trend are .
Following a 3-day Advance, the price is estimated to grow further. Considering data from situations where CMCL advanced for three days, in of 278 cases, the price rose further within the following month. The odds of a continued upward trend are .
CMCL may jump back above the lower band and head toward the middle band. Traders may consider buying the stock or exploring call options.
Fundamental Analysis (Ratings)
The Tickeron Valuation Rating of (best 1 - 100 worst) indicates that the company is seriously undervalued in the industry. This rating compares market capitalization estimated by our proprietary formula with the current market capitalization. This rating is based on the following metrics, as compared to industry averages: P/B Ratio (2.072) is normal, around the industry mean (18.636). P/E Ratio (10.543) is within average values for comparable stocks, (49.494). CMCL's Projected Growth (PEG Ratio) (0.000) is slightly lower than the industry average of (3.046). Dividend Yield (0.021) settles around the average of (0.019) among similar stocks. P/S Ratio (2.173) is also within normal values, averaging (99.797).
The Tickeron Price Growth Rating for this company is (best 1 - 100 worst), indicating steady price growth. CMCL’s price grows at a higher rate over the last 12 months as compared to S&P 500 index constituents.
The Tickeron Profit vs. Risk Rating rating for this company is (best 1 - 100 worst), indicating well-balanced risk and returns. The average Profit vs. Risk Rating rating for the industry is 82, placing this stock slightly better than average.
The Tickeron SMR rating for this company is (best 1 - 100 worst), indicating strong sales and a profitable business model. SMR (Sales, Margin, Return on Equity) rating is based on comparative analysis of weighted Sales, Income Margin and Return on Equity values compared against S&P 500 index constituents. The weighted SMR value is a proprietary formula developed by Tickeron and represents an overall profitability measure for a stock.
The Tickeron PE Growth Rating for this company is (best 1 - 100 worst), pointing to worse than average earnings growth. The PE Growth rating is based on a comparative analysis of stock PE ratio increase over the last 12 months compared against S&P 500 index constituents.
Advertisement
General Information
a mining, exploration and development company
Industry PreciousMetals