CNBB Stock CNB Community Ban (CNBB) is expected to pay dividends on October 10, 2025


at Tickeron.com
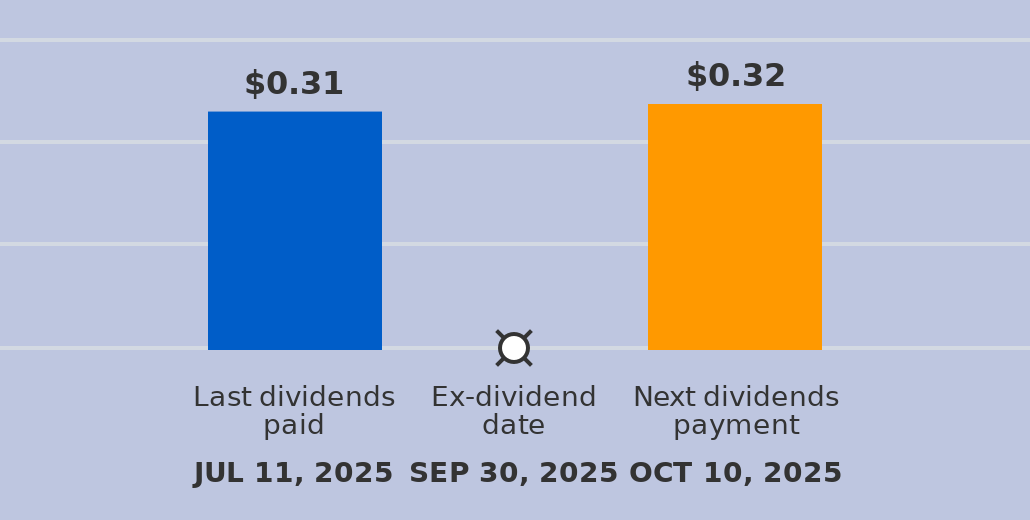
A dividend of $0.32 per share will be paid with a record date of October 10, 2025, and an ex-dividend date of September 30, 2025. The last dividend of $0.31 was paid on July 11, 2025. The ex-dividend date is usually set several business days before the record date. If a stock is purchased on its ex-dividend date or after, the next dividend payment will not be received. Instead, the dividends are repossessed by to the seller. If the stocks are purchased before the ex-dividend date, the buyer will receive the dividends.
Aroon Indicator for CNBB shows an upward move is likely
CNBB's Aroon Indicator triggered a bullish signal on November 24, 2025. Tickeron's A.I.dvisor detected that the AroonUp green line is above 70 while the AroonDown red line is below 30. When the up indicator moves above 70 and the down indicator remains below 30, it is a sign that the stock could be setting up for a bullish move. Traders may want to buy the stock or look to buy calls options. A.I.dvisor looked at 282 similar instances where the Aroon Indicator showed a similar pattern. In of the 282 cases, the stock moved higher in the days that followed. This puts the odds of a move higher at .

Technical Analysis (Indicators)
Bullish Trend Analysis
The RSI Indicator shows that the ticker has stayed in the oversold zone for 3 days. The price of this ticker is presumed to bounce back soon, since the longer the ticker stays in the oversold zone, the more promptly an Uptrend is expected.
The Stochastic Oscillator shows that the ticker has stayed in the oversold zone for 13 days. The price of this ticker is presumed to bounce back soon, since the longer the ticker stays in the oversold zone, the more promptly an upward trend is expected.
Bearish Trend Analysis
The Momentum Indicator moved below the 0 level on November 14, 2025. You may want to consider selling the stock, shorting the stock, or exploring put options on CNBB as a result. In of 81 cases where the Momentum Indicator fell below 0, the stock fell further within the subsequent month. The odds of a continued downward trend are .
The Moving Average Convergence Divergence Histogram (MACD) for CNBB turned negative on November 10, 2025. This could be a sign that the stock is set to turn lower in the coming weeks. Traders may want to sell the stock or buy put options. Tickeron's A.I.dvisor looked at 49 similar instances when the indicator turned negative. In of the 49 cases the stock turned lower in the days that followed. This puts the odds of success at .
Following a 3-day decline, the stock is projected to fall further. Considering past instances where CNBB declined for three days, the price rose further in of 62 cases within the following month. The odds of a continued downward trend are .
Fundamental Analysis (Ratings)
The Tickeron Valuation Rating of (best 1 - 100 worst) indicates that the company is slightly undervalued in the industry. This rating compares market capitalization estimated by our proprietary formula with the current market capitalization. This rating is based on the following metrics, as compared to industry averages: P/B Ratio (0.857) is normal, around the industry mean (1.123). P/E Ratio (7.960) is within average values for comparable stocks, (18.233). Projected Growth (PEG Ratio) (0.000) is also within normal values, averaging (3.226). Dividend Yield (0.028) settles around the average of (0.036) among similar stocks. P/S Ratio (1.682) is also within normal values, averaging (5.219).
The Tickeron PE Growth Rating for this company is (best 1 - 100 worst), pointing to consistent earnings growth. The PE Growth rating is based on a comparative analysis of stock PE ratio increase over the last 12 months compared against S&P 500 index constituents.
The Tickeron Profit vs. Risk Rating rating for this company is (best 1 - 100 worst), indicating well-balanced risk and returns. The average Profit vs. Risk Rating rating for the industry is 51, placing this stock slightly better than average.
The Tickeron SMR rating for this company is (best 1 - 100 worst), indicating slightly weaker than average sales and a marginally profitable business model. SMR (Sales, Margin, Return on Equity) rating is based on comparative analysis of weighted Sales, Income Margin and Return on Equity values compared against S&P 500 index constituents. The weighted SMR value is a proprietary formula developed by Tickeron and represents an overall profitability measure for a stock.
The Tickeron Seasonality Score of (best 1 - 100 worst) indicates that the company is fair valued in the industry. The Tickeron Seasonality score describes the variance of predictable price changes around the same period every calendar year. These changes can be tied to a specific month, quarter, holiday or vacation period, as well as a meteorological or growing season.
The Tickeron Price Growth Rating for this company is (best 1 - 100 worst), indicating fairly steady price growth. CNBB’s price grows at a lower rate over the last 12 months as compared to S&P 500 index constituents.
Advertisement
General Information
Industry RegionalBanks