COTI.X Crypto Tickeron detected bullish Crypto Pattern: Broadening Wedge Descending COTI.X on November 08, 2025, netting in a 24.08% gain over 1 month


at Tickeron.com


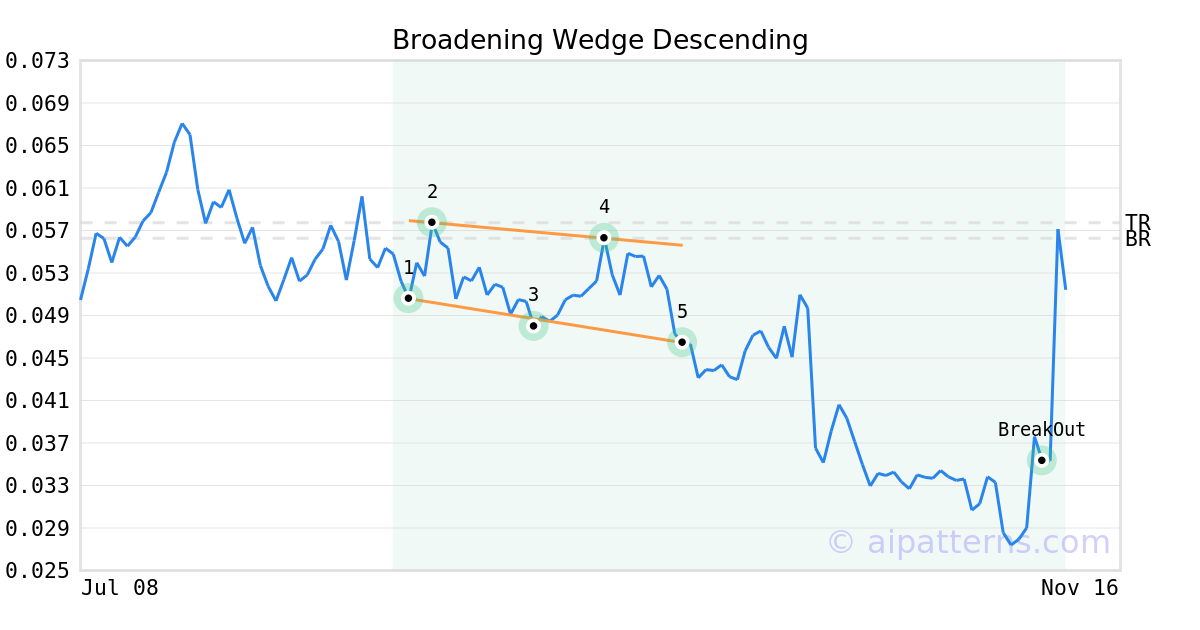
On September 23, 2025, A.I.dvisor detected a Broadening Wedge Descending Pattern (Bullish) for COTI cryptocurrency (COTI.X, $0.046510). On November 08, 2025, A.I.dvisor confirmed the Bullish pattern, setting a target price of $0.057730. On November 08, 2025, COTI.X reached the target price resulting in a +2 for traders who took a long position in the stock.
COTI.X's Stochastic Oscillator sits in oversold zone for 12 days
The price of this ticker is presumed to bounce back soon, since the longer the ticker stays in the oversold zone, the more promptly an uptrend is expected.

Technical Analysis (Indicators)
Bullish Trend Analysis
Following a 3-day Advance, the price is estimated to grow further. Considering data from situations where COTI.X advanced for three days, in of 422 cases, the price rose further within the following month. The odds of a continued upward trend are .
Bearish Trend Analysis
The 10-day RSI Indicator for COTI.X moved out of overbought territory on November 10, 2025. This could be a bearish sign for the stock. Traders may want to consider selling the stock or buying put options. Tickeron's A.I.dvisor looked at 39 similar instances where the indicator moved out of overbought territory. In of the 39 cases, the stock moved lower in the following days. This puts the odds of a move lower at .
The Momentum Indicator moved below the 0 level on November 17, 2025. You may want to consider selling the stock, shorting the stock, or exploring put options on COTI.X as a result. In of 135 cases where the Momentum Indicator fell below 0, the stock fell further within the subsequent month. The odds of a continued downward trend are .
The Moving Average Convergence Divergence Histogram (MACD) for COTI.X turned negative on November 17, 2025. This could be a sign that the stock is set to turn lower in the coming weeks. Traders may want to sell the stock or buy put options. Tickeron's A.I.dvisor looked at 61 similar instances when the indicator turned negative. In of the 61 cases the stock turned lower in the days that followed. This puts the odds of success at .
COTI.X moved below its 50-day moving average on November 12, 2025 date and that indicates a change from an upward trend to a downward trend.
The 10-day moving average for COTI.X crossed bearishly below the 50-day moving average on November 19, 2025. This indicates that the trend has shifted lower and could be considered a sell signal. In of 24 past instances when the 10-day crossed below the 50-day, the stock continued to move higher over the following month. The odds of a continued downward trend are .
Following a 3-day decline, the stock is projected to fall further. Considering past instances where COTI.X declined for three days, the price rose further in of 62 cases within the following month. The odds of a continued downward trend are .
COTI.X broke above its upper Bollinger Band on November 09, 2025. This could be a sign that the stock is set to drop as the stock moves back below the upper band and toward the middle band. You may want to consider selling the stock or exploring put options.
The Aroon Indicator for COTI.X entered a downward trend on November 08, 2025. This could indicate a strong downward move is ahead for the stock. Traders may want to consider selling the stock or buying put options.