CPAC Stock Tickeron detected bearish Stock Pattern: Triangle Descending on November 20, 2025


at Tickeron.com


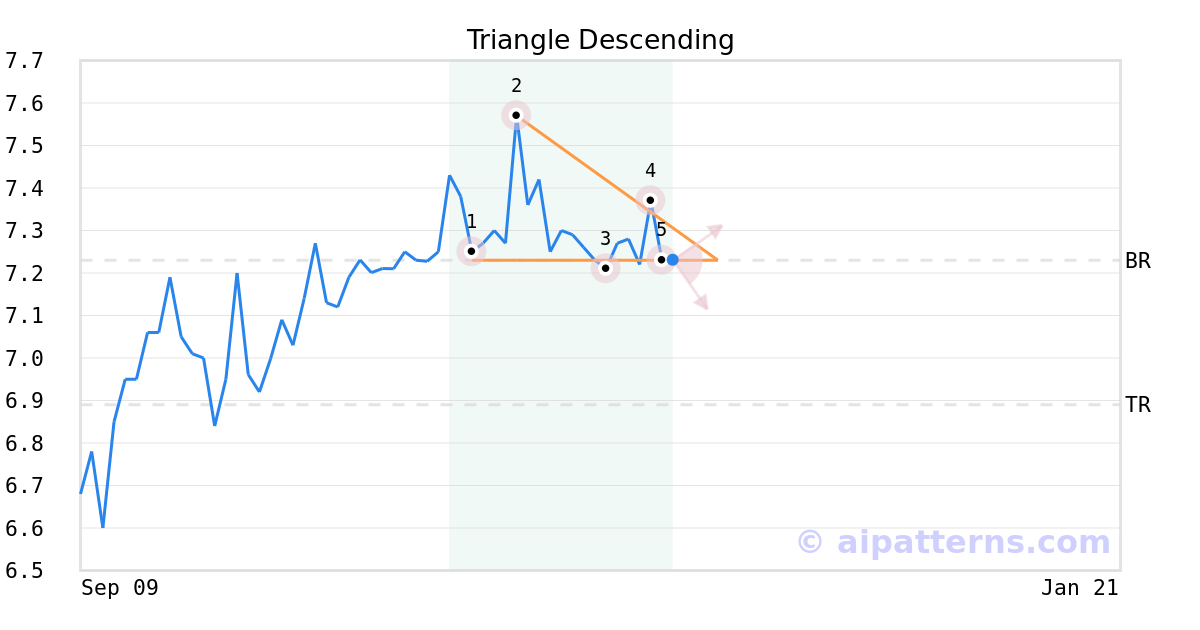
A.I.dvisor detected a bearish Triangle Descending pattern for CPAC stock. This pattern was detected on November 20, 2025 . The odds of reaching the target price are 6.
The Descending Triangle pattern has a horizontal bottom (1, 3, 5) which represents the support level, and a down-sloping top line (2, 4).
Consider selling the security short or buying a put option at the downward breakout price level. When trading, wait for the confirmation move, which is when the price falls below the breakout level.
CPAC's RSI Indicator recovers from overbought zone
The 10-day RSI Oscillator for CPAC moved out of overbought territory on November 04, 2025. This could be a sign that the stock is shifting from an upward trend to a downward trend. Traders may want to look at selling the stock or buying put options. Tickeron's A.I.dvisor looked at 28 instances where the indicator moved out of the overbought zone. In of the 28 cases the stock moved lower in the days that followed. This puts the odds of a move down at .

Technical Analysis (Indicators)
Bearish Trend Analysis
The Momentum Indicator moved below the 0 level on November 17, 2025. You may want to consider selling the stock, shorting the stock, or exploring put options on CPAC as a result. In of 110 cases where the Momentum Indicator fell below 0, the stock fell further within the subsequent month. The odds of a continued downward trend are .
The Moving Average Convergence Divergence Histogram (MACD) for CPAC turned negative on November 04, 2025. This could be a sign that the stock is set to turn lower in the coming weeks. Traders may want to sell the stock or buy put options. Tickeron's A.I.dvisor looked at 51 similar instances when the indicator turned negative. In of the 51 cases the stock turned lower in the days that followed. This puts the odds of success at .
Following a 3-day decline, the stock is projected to fall further. Considering past instances where CPAC declined for three days, the price rose further in of 62 cases within the following month. The odds of a continued downward trend are .
CPAC broke above its upper Bollinger Band on November 03, 2025. This could be a sign that the stock is set to drop as the stock moves back below the upper band and toward the middle band. You may want to consider selling the stock or exploring put options.
Bullish Trend Analysis
The Stochastic Oscillator suggests the stock price trend may be in a reversal from a downward trend to an upward trend. of 62 cases where CPAC's Stochastic Oscillator exited the oversold zone resulted in an increase in price. Tickeron's analysis proposes that the odds of a continued upward trend are .
Following a 3-day Advance, the price is estimated to grow further. Considering data from situations where CPAC advanced for three days, in of 256 cases, the price rose further within the following month. The odds of a continued upward trend are .
The Aroon Indicator entered an Uptrend today. In of 216 cases where CPAC Aroon's Indicator entered an Uptrend, the price rose further within the following month. The odds of a continued Uptrend are .
Fundamental Analysis (Ratings)
The Tickeron Valuation Rating of (best 1 - 100 worst) indicates that the company is seriously undervalued in the industry. This rating compares market capitalization estimated by our proprietary formula with the current market capitalization. This rating is based on the following metrics, as compared to industry averages: P/B Ratio (1.535) is normal, around the industry mean (2.031). P/E Ratio (9.735) is within average values for comparable stocks, (37.628). CPAC's Projected Growth (PEG Ratio) (0.000) is slightly lower than the industry average of (1.926). Dividend Yield (0.076) settles around the average of (0.040) among similar stocks. P/S Ratio (1.029) is also within normal values, averaging (32.449).
The Tickeron Profit vs. Risk Rating rating for this company is (best 1 - 100 worst), indicating well-balanced risk and returns. The average Profit vs. Risk Rating rating for the industry is 68, placing this stock slightly better than average.
The Tickeron Price Growth Rating for this company is (best 1 - 100 worst), indicating steady price growth. CPAC’s price grows at a higher rate over the last 12 months as compared to S&P 500 index constituents.
The Tickeron Seasonality Score of (best 1 - 100 worst) indicates that the company is fair valued in the industry. The Tickeron Seasonality score describes the variance of predictable price changes around the same period every calendar year. These changes can be tied to a specific month, quarter, holiday or vacation period, as well as a meteorological or growing season.
The Tickeron SMR rating for this company is (best 1 - 100 worst), indicating strong sales and a profitable business model. SMR (Sales, Margin, Return on Equity) rating is based on comparative analysis of weighted Sales, Income Margin and Return on Equity values compared against S&P 500 index constituents. The weighted SMR value is a proprietary formula developed by Tickeron and represents an overall profitability measure for a stock.
The Tickeron PE Growth Rating for this company is (best 1 - 100 worst), pointing to average earnings growth. The PE Growth rating is based on a comparative analysis of stock PE ratio increase over the last 12 months compared against S&P 500 index constituents.
Advertisement
General Information
a producer of cement, quicklime, aggregates, ready-mix concrete, precast concrete products and other construction materials
Industry ConstructionMaterials