CRC Stock Tickeron detected bullish Stock Pattern: Broadening Bottom on November 20, 2025


at Tickeron.com


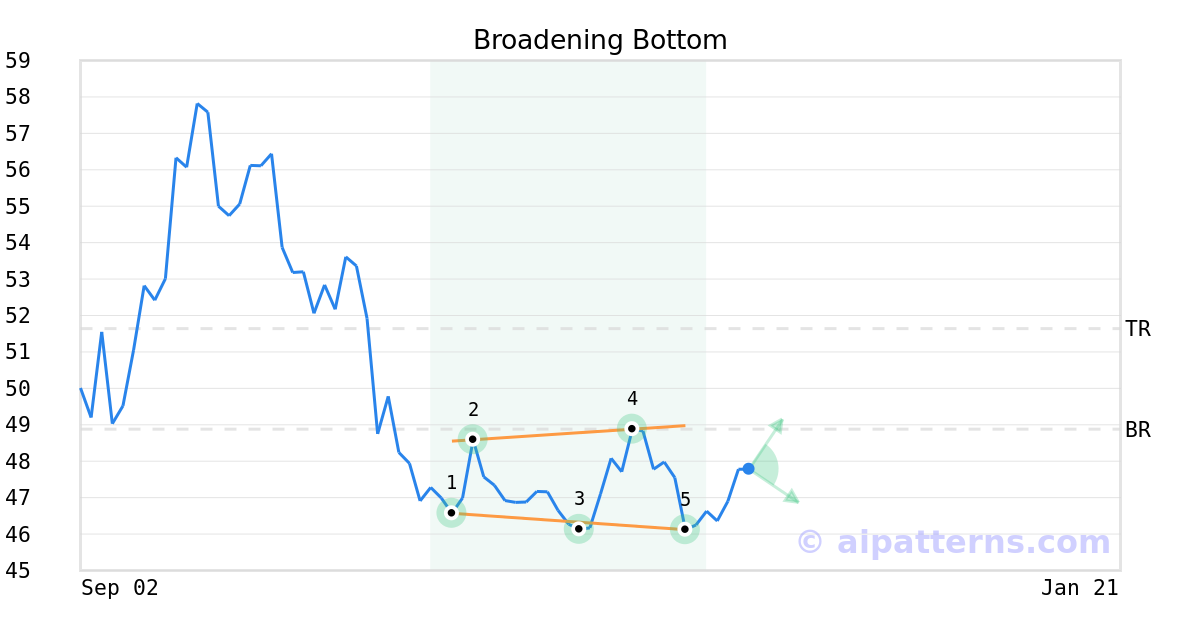
A.I.dvisor detected a bullish Broadening Bottom pattern for CRC stock. This pattern was detected on November 20, 2025 . The odds of reaching the target price are 6.
The Broadening Bottom pattern is formed when the price of a security progressively makes higher highs (2, 4) and lower lows (1, 3, 5) following two widening trend lines.
Consider buying a security or call option at the upward breakout price/entry point.
CRC sees its Stochastic Oscillator climbs out of oversold territory
On November 28, 2025, the Stochastic Oscillator for CRC moved out of oversold territory and this could be a bullish sign for the stock. Traders may want to buy the stock or buy call options. Tickeron's A.I.dvisor looked at 55 instances where the indicator left the oversold zone. In of the 55 cases the stock moved higher in the following days. This puts the odds of a move higher at over .

Technical Analysis (Indicators)
Bullish Trend Analysis
The Moving Average Convergence Divergence (MACD) for CRC just turned positive on November 03, 2025. Looking at past instances where CRC's MACD turned positive, the stock continued to rise in of 44 cases over the following month. The odds of a continued upward trend are .
Following a 3-day Advance, the price is estimated to grow further. Considering data from situations where CRC advanced for three days, in of 315 cases, the price rose further within the following month. The odds of a continued upward trend are .
Bearish Trend Analysis
The Momentum Indicator moved below the 0 level on November 24, 2025. You may want to consider selling the stock, shorting the stock, or exploring put options on CRC as a result. In of 88 cases where the Momentum Indicator fell below 0, the stock fell further within the subsequent month. The odds of a continued downward trend are .
Following a 3-day decline, the stock is projected to fall further. Considering past instances where CRC declined for three days, the price rose further in of 62 cases within the following month. The odds of a continued downward trend are .
CRC broke above its upper Bollinger Band on November 13, 2025. This could be a sign that the stock is set to drop as the stock moves back below the upper band and toward the middle band. You may want to consider selling the stock or exploring put options.
The Aroon Indicator for CRC entered a downward trend on November 14, 2025. This could indicate a strong downward move is ahead for the stock. Traders may want to consider selling the stock or buying put options.
Fundamental Analysis (Ratings)
The Tickeron PE Growth Rating for this company is (best 1 - 100 worst), pointing to outstanding earnings growth. The PE Growth rating is based on a comparative analysis of stock PE ratio increase over the last 12 months compared against S&P 500 index constituents.
The Tickeron Profit vs. Risk Rating rating for this company is (best 1 - 100 worst), indicating well-balanced risk and returns. The average Profit vs. Risk Rating rating for the industry is 73, placing this stock slightly better than average.
The Tickeron Price Growth Rating for this company is (best 1 - 100 worst), indicating fairly steady price growth. CRC’s price grows at a lower rate over the last 12 months as compared to S&P 500 index constituents.
The Tickeron SMR rating for this company is (best 1 - 100 worst), indicating strong sales and a profitable business model. SMR (Sales, Margin, Return on Equity) rating is based on comparative analysis of weighted Sales, Income Margin and Return on Equity values compared against S&P 500 index constituents. The weighted SMR value is a proprietary formula developed by Tickeron and represents an overall profitability measure for a stock.
The Tickeron Valuation Rating of (best 1 - 100 worst) indicates that the company is significantly overvalued in the industry. This rating compares market capitalization estimated by our proprietary formula with the current market capitalization. This rating is based on the following metrics, as compared to industry averages: P/B Ratio (1.153) is normal, around the industry mean (11.272). P/E Ratio (11.374) is within average values for comparable stocks, (25.653). CRC's Projected Growth (PEG Ratio) (22.898) is very high in comparison to the industry average of (4.191). Dividend Yield (0.033) settles around the average of (0.077) among similar stocks. P/S Ratio (1.211) is also within normal values, averaging (169.923).
Advertisement
General Information
an oil and natural gas exploration and production company
Industry OilGasProduction