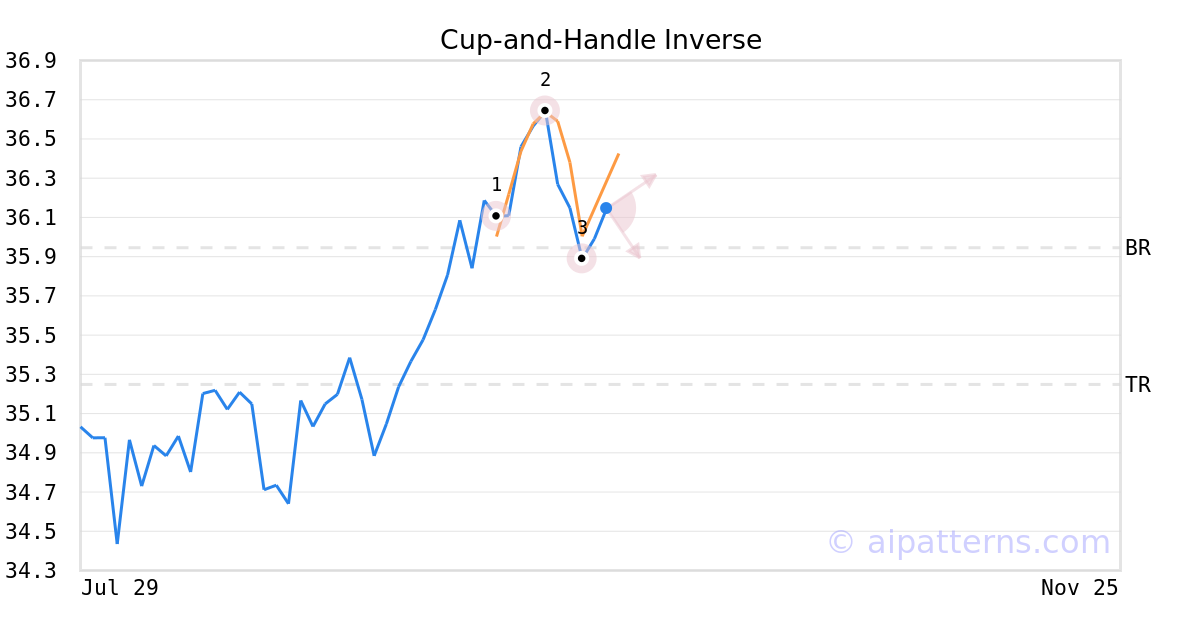
CRTC Stock Tickeron detected bearish ETF Pattern: Cup-and-Handle Inverse on September 30, 2025


at Tickeron.com


Momentum Indicator for CRTC turns negative, indicating new downward trend
CRTC saw its Momentum Indicator move below the 0 level on October 14, 2025. This is an indication that the stock could be shifting in to a new downward move. Traders may want to consider selling the stock or exploring put options. Tickeron's A.I.dvisor looked at 25 similar instances where the indicator turned negative. In of the 25 cases, the stock moved further down in the following days. The odds of a decline are at .

Technical Analysis (Indicators)
Bearish Trend Analysis
The 10-day RSI Indicator for CRTC moved out of overbought territory on October 07, 2025. This could be a bearish sign for the stock. Traders may want to consider selling the stock or buying put options. Tickeron's A.I.dvisor looked at 21 similar instances where the indicator moved out of overbought territory. In of the 21 cases, the stock moved lower in the following days. This puts the odds of a move lower at .
The Moving Average Convergence Divergence Histogram (MACD) for CRTC turned negative on October 09, 2025. This could be a sign that the stock is set to turn lower in the coming weeks. Traders may want to sell the stock or buy put options. Tickeron's A.I.dvisor looked at 17 similar instances when the indicator turned negative. In of the 17 cases the stock turned lower in the days that followed. This puts the odds of success at .
Following a 3-day decline, the stock is projected to fall further. Considering past instances where CRTC declined for three days, the price rose further in of 62 cases within the following month. The odds of a continued downward trend are .
Bullish Trend Analysis
The Stochastic Oscillator suggests the stock price trend may be in a reversal from a downward trend to an upward trend. of 17 cases where CRTC's Stochastic Oscillator exited the oversold zone resulted in an increase in price. Tickeron's analysis proposes that the odds of a continued upward trend are .
Following a 3-day Advance, the price is estimated to grow further. Considering data from situations where CRTC advanced for three days, in of 149 cases, the price rose further within the following month. The odds of a continued upward trend are .
The Aroon Indicator entered an Uptrend today. In of 162 cases where CRTC Aroon's Indicator entered an Uptrend, the price rose further within the following month. The odds of a continued Uptrend are .


Advertisement
General Information
Category Technology