CSCO Stock Tickeron detected bullish Stock Pattern: Broadening Wedge Ascending CSCO on October 08, 2025, netting in a 5.16% gain over 1 month


at Tickeron.com


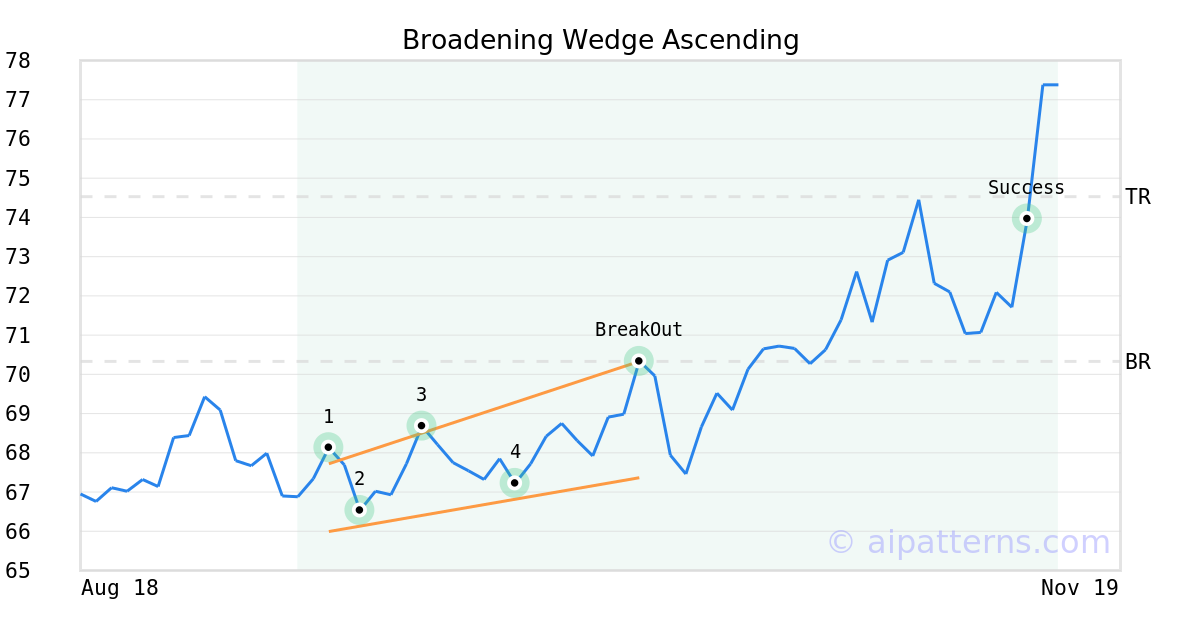
On October 08, 2025, A.I.dvisor detected a Broadening Wedge Ascending Pattern (Bullish) for Cisco Systems (CSCO, $70.33). On October 08, 2025, A.I.dvisor confirmed the Bullish pattern, setting a target price of $74.53. 35 days later, on November 12, 2025, CSCO reached the target price resulting in a for traders who took a long position in the stock.
Aroon Indicator for CSCO shows an upward move is likely
CSCO's Aroon Indicator triggered a bullish signal on December 01, 2025. Tickeron's A.I.dvisor detected that the AroonUp green line is above 70 while the AroonDown red line is below 30. When the up indicator moves above 70 and the down indicator remains below 30, it is a sign that the stock could be setting up for a bullish move. Traders may want to buy the stock or look to buy calls options. A.I.dvisor looked at 322 similar instances where the Aroon Indicator showed a similar pattern. In of the 322 cases, the stock moved higher in the days that followed. This puts the odds of a move higher at .

Technical Analysis (Indicators)
Bullish Trend Analysis
The Stochastic Oscillator is in the oversold zone. Keep an eye out for a move up in the foreseeable future.
Following a 3-day Advance, the price is estimated to grow further. Considering data from situations where CSCO advanced for three days, in of 353 cases, the price rose further within the following month. The odds of a continued upward trend are .
Bearish Trend Analysis
The 10-day RSI Indicator for CSCO moved out of overbought territory on November 20, 2025. This could be a bearish sign for the stock. Traders may want to consider selling the stock or buying put options. Tickeron's A.I.dvisor looked at 48 similar instances where the indicator moved out of overbought territory. In of the 48 cases, the stock moved lower in the following days. This puts the odds of a move lower at .
The Momentum Indicator moved below the 0 level on November 28, 2025. You may want to consider selling the stock, shorting the stock, or exploring put options on CSCO as a result. In of 83 cases where the Momentum Indicator fell below 0, the stock fell further within the subsequent month. The odds of a continued downward trend are .
The Moving Average Convergence Divergence Histogram (MACD) for CSCO turned negative on November 26, 2025. This could be a sign that the stock is set to turn lower in the coming weeks. Traders may want to sell the stock or buy put options. Tickeron's A.I.dvisor looked at 53 similar instances when the indicator turned negative. In of the 53 cases the stock turned lower in the days that followed. This puts the odds of success at .
Following a 3-day decline, the stock is projected to fall further. Considering past instances where CSCO declined for three days, the price rose further in of 62 cases within the following month. The odds of a continued downward trend are .
CSCO broke above its upper Bollinger Band on November 13, 2025. This could be a sign that the stock is set to drop as the stock moves back below the upper band and toward the middle band. You may want to consider selling the stock or exploring put options.
Fundamental Analysis (Ratings)
The Tickeron Valuation Rating of (best 1 - 100 worst) indicates that the company is seriously undervalued in the industry. This rating compares market capitalization estimated by our proprietary formula with the current market capitalization. This rating is based on the following metrics, as compared to industry averages: P/B Ratio (6.485) is normal, around the industry mean (5.009). P/E Ratio (29.707) is within average values for comparable stocks, (44.872). CSCO's Projected Growth (PEG Ratio) (1.821) is slightly higher than the industry average of (1.175). Dividend Yield (0.021) settles around the average of (0.031) among similar stocks. P/S Ratio (5.325) is also within normal values, averaging (23.307).
The Tickeron Price Growth Rating for this company is (best 1 - 100 worst), indicating outstanding price growth. CSCO’s price grows at a higher rate over the last 12 months as compared to S&P 500 index constituents.
The Tickeron Profit vs. Risk Rating rating for this company is (best 1 - 100 worst), indicating low risk on high returns. The average Profit vs. Risk Rating rating for the industry is 77, placing this stock better than average.
The Tickeron PE Growth Rating for this company is (best 1 - 100 worst), pointing to outstanding earnings growth. The PE Growth rating is based on a comparative analysis of stock PE ratio increase over the last 12 months compared against S&P 500 index constituents.
The Tickeron SMR rating for this company is (best 1 - 100 worst), indicating strong sales and a profitable business model. SMR (Sales, Margin, Return on Equity) rating is based on comparative analysis of weighted Sales, Income Margin and Return on Equity values compared against S&P 500 index constituents. The weighted SMR value is a proprietary formula developed by Tickeron and represents an overall profitability measure for a stock.
The Tickeron Seasonality Score of (best 1 - 100 worst) indicates that the company is fair valued in the industry. The Tickeron Seasonality score describes the variance of predictable price changes around the same period every calendar year. These changes can be tied to a specific month, quarter, holiday or vacation period, as well as a meteorological or growing season.
Advertisement
General Information
a manufacturer of Internet Protocol based networking products and services related to the communications and information technology industry
Industry TelecommunicationsEquipment