CTS Stock Tickeron detected bullish Stock Pattern: Three Rising Valleys on November 17, 2025


at Tickeron.com


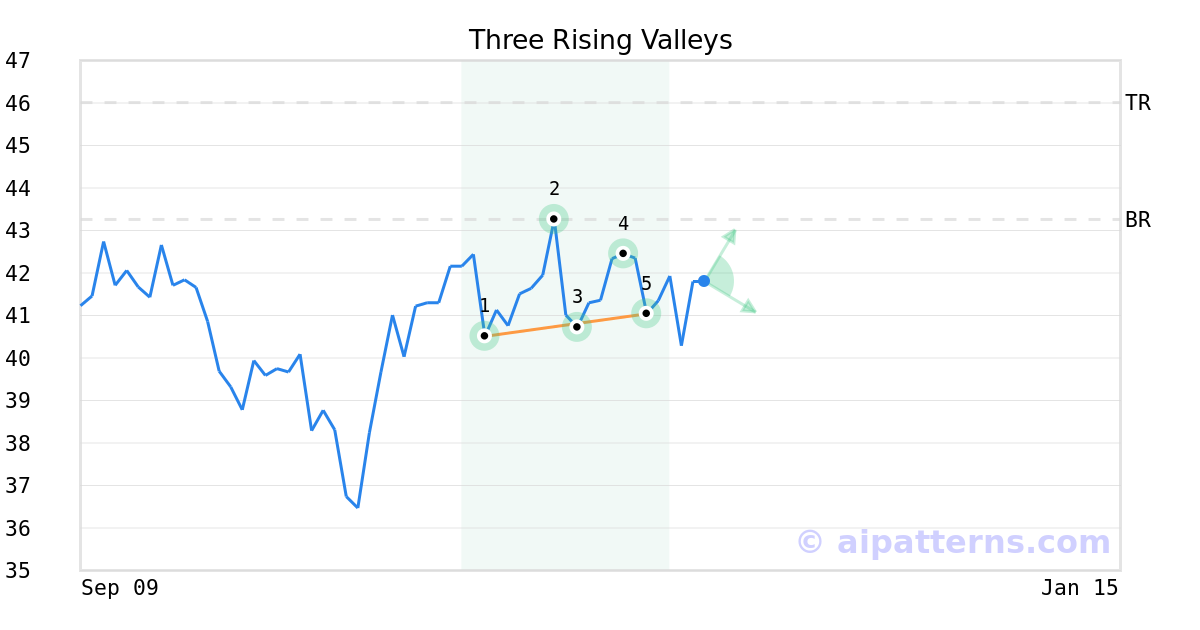
A.I.dvisor detected a bullish Three Rising Valleys pattern for CTS stock. This pattern was detected on November 17, 2025 . The odds of reaching the target price are 6.
The Three Rising Valleys pattern forms when three minor Lows (1, 3, 5) are arranged along an upward sloping trend line.
Consider buying a security or call option at the breakout price level. When trading, wait for the confirmation move, which is when the price rises above the breakout level.
CTS's MACD Histogram crosses above signal line
The Moving Average Convergence Divergence (MACD) for CTS turned positive on November 25, 2025. Looking at past instances where CTS's MACD turned positive, the stock continued to rise in of 45 cases over the following month. The odds of a continued upward trend are .

Technical Analysis (Indicators)
Bullish Trend Analysis
The Momentum Indicator moved above the 0 level on December 01, 2025. You may want to consider a long position or call options on CTS as a result. In of 93 past instances where the momentum indicator moved above 0, the stock continued to climb. The odds of a continued upward trend are .
CTS moved above its 50-day moving average on November 21, 2025 date and that indicates a change from a downward trend to an upward trend.
The 10-day moving average for CTS crossed bullishly above the 50-day moving average on October 28, 2025. This indicates that the trend has shifted higher and could be considered a buy signal. In of 19 past instances when the 10-day crossed above the 50-day, the stock continued to move higher over the following month. The odds of a continued upward trend are .
Following a 3-day Advance, the price is estimated to grow further. Considering data from situations where CTS advanced for three days, in of 288 cases, the price rose further within the following month. The odds of a continued upward trend are .
The Aroon Indicator entered an Uptrend today. In of 181 cases where CTS Aroon's Indicator entered an Uptrend, the price rose further within the following month. The odds of a continued Uptrend are .
Bearish Trend Analysis
The Stochastic Oscillator entered the overbought zone. Expect a price pull-back in the foreseeable future.
Following a 3-day decline, the stock is projected to fall further. Considering past instances where CTS declined for three days, the price rose further in of 62 cases within the following month. The odds of a continued downward trend are .
CTS broke above its upper Bollinger Band on December 02, 2025. This could be a sign that the stock is set to drop as the stock moves back below the upper band and toward the middle band. You may want to consider selling the stock or exploring put options.
Fundamental Analysis (Ratings)
The Tickeron Valuation Rating of (best 1 - 100 worst) indicates that the company is slightly undervalued in the industry. This rating compares market capitalization estimated by our proprietary formula with the current market capitalization. This rating is based on the following metrics, as compared to industry averages: P/B Ratio (2.316) is normal, around the industry mean (5.330). P/E Ratio (22.051) is within average values for comparable stocks, (57.826). Projected Growth (PEG Ratio) (0.000) is also within normal values, averaging (1.462). CTS has a moderately low Dividend Yield (0.004) as compared to the industry average of (0.022). P/S Ratio (2.476) is also within normal values, averaging (3.194).
The Tickeron Seasonality Score of (best 1 - 100 worst) indicates that the company is fair valued in the industry. The Tickeron Seasonality score describes the variance of predictable price changes around the same period every calendar year. These changes can be tied to a specific month, quarter, holiday or vacation period, as well as a meteorological or growing season.
The Tickeron Profit vs. Risk Rating rating for this company is (best 1 - 100 worst), indicating well-balanced risk and returns. The average Profit vs. Risk Rating rating for the industry is 77, placing this stock slightly better than average.
The Tickeron Price Growth Rating for this company is (best 1 - 100 worst), indicating fairly steady price growth. CTS’s price grows at a lower rate over the last 12 months as compared to S&P 500 index constituents.
The Tickeron SMR rating for this company is (best 1 - 100 worst), indicating strong sales and a profitable business model. SMR (Sales, Margin, Return on Equity) rating is based on comparative analysis of weighted Sales, Income Margin and Return on Equity values compared against S&P 500 index constituents. The weighted SMR value is a proprietary formula developed by Tickeron and represents an overall profitability measure for a stock.
The Tickeron PE Growth Rating for this company is (best 1 - 100 worst), pointing to worse than average earnings growth. The PE Growth rating is based on a comparative analysis of stock PE ratio increase over the last 12 months compared against S&P 500 index constituents.
Advertisement
General Information
a manufacturer of electronic components and sensors
Industry ElectronicComponents