CUYTY Stock COLRUYT GROUP (CUYTY) is expected to pay dividends on October 15, 2025


at Tickeron.com
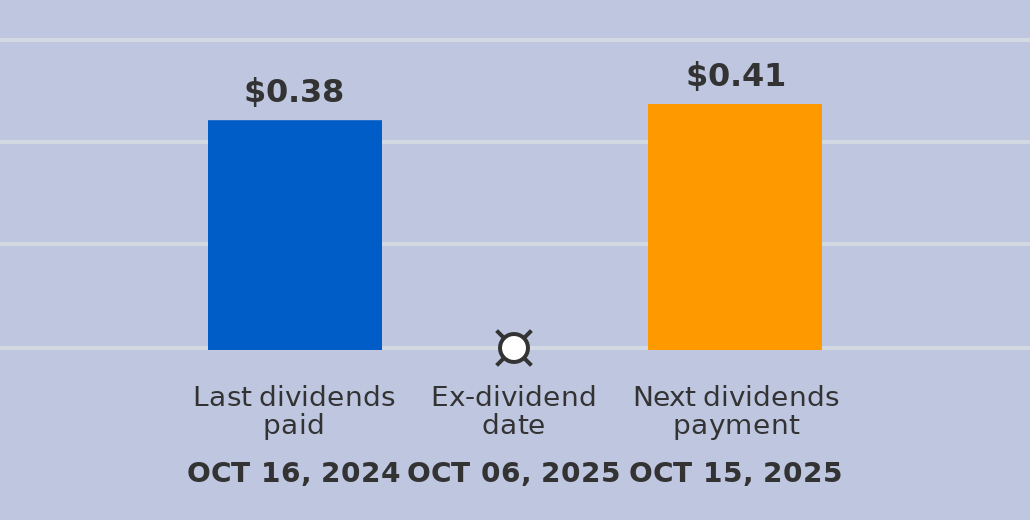
A dividend of $0.41 per share will be paid with a record date of October 15, 2025, and an ex-dividend date of October 06, 2025. The last dividend of $0.38 was paid on October 16, 2024. The ex-dividend date is usually set several business days before the record date. If a stock is purchased on its ex-dividend date or after, the next dividend payment will not be received. Instead, the dividends are repossessed by to the seller. If the stocks are purchased before the ex-dividend date, the buyer will receive the dividends.
CUYTY sees its 50-day moving average cross bearishly below its 200-day moving average
The 50-day moving average for CUYTY moved below the 200-day moving average on November 06, 2025. This could be a long-term bearish signal for the stock as the stock shifts to an downward trend.

Technical Analysis (Indicators)
Bearish Trend Analysis
The Stochastic Oscillator has been in the overbought zone for 1 day. Expect a price pull-back in the near future.
Bullish Trend Analysis
The RSI Indicator points to a transition from a downward trend to an upward trend -- in cases where CUYTY's RSI Indicator exited the oversold zone, of 34 resulted in an increase in price. Tickeron's analysis proposes that the odds of a continued upward trend are .
The Momentum Indicator moved above the 0 level on November 24, 2025. You may want to consider a long position or call options on CUYTY as a result. In of 65 past instances where the momentum indicator moved above 0, the stock continued to climb. The odds of a continued upward trend are .
Following a 3-day Advance, the price is estimated to grow further. Considering data from situations where CUYTY advanced for three days, in of 47 cases, the price rose further within the following month. The odds of a continued upward trend are .
CUYTY may jump back above the lower band and head toward the middle band. Traders may consider buying the stock or exploring call options.
Fundamental Analysis (Ratings)
The Tickeron PE Growth Rating for this company is (best 1 - 100 worst), pointing to outstanding earnings growth. The PE Growth rating is based on a comparative analysis of stock PE ratio increase over the last 12 months compared against S&P 500 index constituents.
The Tickeron Price Growth Rating for this company is (best 1 - 100 worst), indicating steady price growth. CUYTY’s price grows at a higher rate over the last 12 months as compared to S&P 500 index constituents.
The Tickeron SMR rating for this company is (best 1 - 100 worst), indicating weak sales and an unprofitable business model. SMR (Sales, Margin, Return on Equity) rating is based on comparative analysis of weighted Sales, Income Margin and Return on Equity values compared against S&P 500 index constituents. The weighted SMR value is a proprietary formula developed by Tickeron and represents an overall profitability measure for a stock.
The Tickeron Valuation Rating of (best 1 - 100 worst) indicates that the company is significantly overvalued in the industry. This rating compares market capitalization estimated by our proprietary formula with the current market capitalization. This rating is based on the following metrics, as compared to industry averages: P/B Ratio (1.250) is normal, around the industry mean (2.941). P/E Ratio (12.118) is within average values for comparable stocks, (28.593). CUYTY's Projected Growth (PEG Ratio) (0.000) is slightly lower than the industry average of (1.944). Dividend Yield (0.042) settles around the average of (0.029) among similar stocks. P/S Ratio (0.370) is also within normal values, averaging (0.522).
The Tickeron Profit vs. Risk Rating rating for this company is (best 1 - 100 worst), indicating that the returns do not compensate for the risks. CUYTY’s unstable profits reported over time resulted in significant Drawdowns within these last five years. A stable profit reduces stock drawdown and volatility. The average Profit vs. Risk Rating rating for the industry is 68, placing this stock worse than average.
Advertisement
General Information
Industry FoodRetail