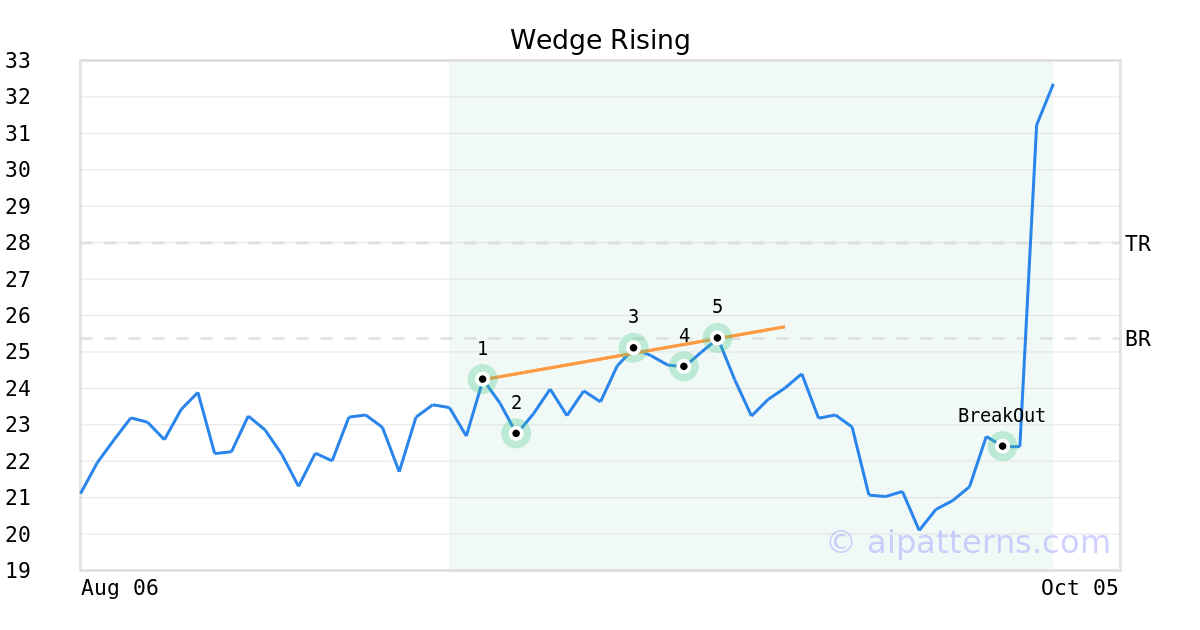
DASH.X Crypto Tickeron detected bullish Crypto Pattern: Wedge Rising DASH.X on September 30, 2025, netting in a 11.65% gain over 2 weeks


at Tickeron.com


Aroon Indicator for DASH.X shows an upward move is likely
DASH.X's Aroon Indicator triggered a bullish signal on October 20, 2025. Tickeron's A.I.dvisor detected that the AroonUp green line is above 70 while the AroonDown red line is below 30. When the up indicator moves above 70 and the down indicator remains below 30, it is a sign that the stock could be setting up for a bullish move. Traders may want to buy the stock or look to buy calls options. A.I.dvisor looked at 272 similar instances where the Aroon Indicator showed a similar pattern. In of the 272 cases, the stock moved higher in the days that followed. This puts the odds of a move higher at .

Technical Analysis (Indicators)
Bullish Trend Analysis
The Momentum Indicator moved above the 0 level on October 01, 2025. You may want to consider a long position or call options on DASH.X as a result. In of 135 past instances where the momentum indicator moved above 0, the stock continued to climb. The odds of a continued upward trend are .
The Moving Average Convergence Divergence (MACD) for DASH.X just turned positive on October 01, 2025. Looking at past instances where DASH.X's MACD turned positive, the stock continued to rise in of 62 cases over the following month. The odds of a continued upward trend are .
DASH.X moved above its 50-day moving average on October 01, 2025 date and that indicates a change from a downward trend to an upward trend.
The 10-day moving average for DASH.X crossed bullishly above the 50-day moving average on October 02, 2025. This indicates that the trend has shifted higher and could be considered a buy signal. In of 22 past instances when the 10-day crossed above the 50-day, the stock continued to move higher over the following month. The odds of a continued upward trend are .
Following a +1 3-day Advance, the price is estimated to grow further. Considering data from situations where DASH.X advanced for three days, in of 480 cases, the price rose further within the following month. The odds of a continued upward trend are .
Bearish Trend Analysis
The 10-day RSI Indicator for DASH.X moved out of overbought territory on October 14, 2025. This could be a bearish sign for the stock. Traders may want to consider selling the stock or buying put options. Tickeron's A.I.dvisor looked at 46 similar instances where the indicator moved out of overbought territory. In of the 46 cases, the stock moved lower in the following days. This puts the odds of a move lower at .
The Stochastic Oscillator may be shifting from an upward trend to a downward trend. In of 92 cases where DASH.X's Stochastic Oscillator exited the overbought zone, the price fell further within the following month. The odds of a continued downward trend are .
Following a 3-day decline, the stock is projected to fall further. Considering past instances where DASH.X declined for three days, the price rose further in of 62 cases within the following month. The odds of a continued downward trend are .
DASH.X broke above its upper Bollinger Band on October 12, 2025. This could be a sign that the stock is set to drop as the stock moves back below the upper band and toward the middle band. You may want to consider selling the stock or exploring put options.


Advertisement