DCOR Stock Tickeron detected bearish ETF Pattern: Triple Tops on October 21, 2025


at Tickeron.com


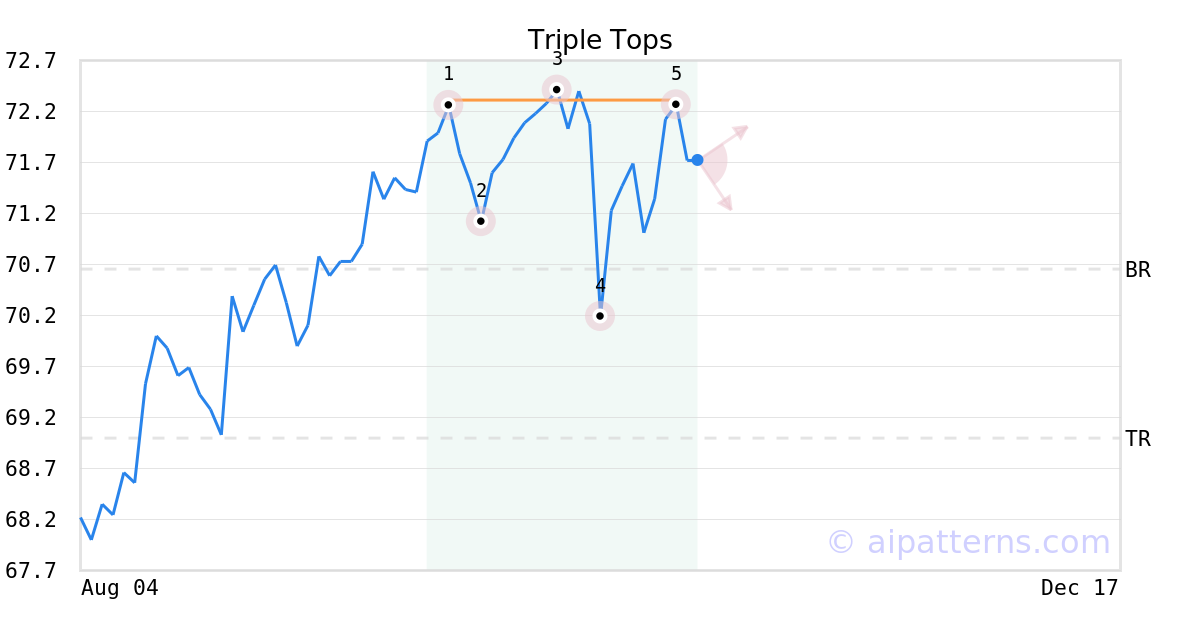
A.I.dvisor detected a bearish Triple Tops pattern for DCOR stock. This pattern was detected on October 21, 2025 . The odds of reaching the target price are 6.
The Triple Tops pattern appears when there are three distinct minor Highs (1, 3, 5) at about the same price level. The security is testing the upper resistance level (horizontal line formed by (1, 3, 5).
Consider selling the security short or buying a put option at a downward breakout price level. When trading, wait for the confirmation move, which is when the price falls below the breakout level.
DCOR in downward trend: price dove below 50-day moving average on November 17, 2025
DCOR moved below its 50-day moving average on November 17, 2025 date and that indicates a change from an upward trend to a downward trend. In of 8 similar past instances, the stock price decreased further within the following month. The odds of a continued downward trend are .

Technical Analysis (Indicators)
Bearish Trend Analysis
The Momentum Indicator moved below the 0 level on November 13, 2025. You may want to consider selling the stock, shorting the stock, or exploring put options on DCOR as a result. In of 27 cases where the Momentum Indicator fell below 0, the stock fell further within the subsequent month. The odds of a continued downward trend are .
The Moving Average Convergence Divergence Histogram (MACD) for DCOR turned negative on November 13, 2025. This could be a sign that the stock is set to turn lower in the coming weeks. Traders may want to sell the stock or buy put options. Tickeron's A.I.dvisor looked at 24 similar instances when the indicator turned negative. In of the 24 cases the stock turned lower in the days that followed. This puts the odds of success at .
Following a 3-day decline, the stock is projected to fall further. Considering past instances where DCOR declined for three days, the price rose further in of 62 cases within the following month. The odds of a continued downward trend are .
Bullish Trend Analysis
The Stochastic Oscillator is in the oversold zone. Keep an eye out for a move up in the foreseeable future.
Following a 3-day Advance, the price is estimated to grow further. Considering data from situations where DCOR advanced for three days, in of 151 cases, the price rose further within the following month. The odds of a continued upward trend are .
DCOR may jump back above the lower band and head toward the middle band. Traders may consider buying the stock or exploring call options.
The Aroon Indicator entered an Uptrend today. In of 193 cases where DCOR Aroon's Indicator entered an Uptrend, the price rose further within the following month. The odds of a continued Uptrend are .
Advertisement
General Information
Category LargeBlend