DCR.X Crypto Tickeron detected bullish Crypto Pattern: Broadening Bottom DCR.X on November 01, 2025, netting in a 20.08% gain over 3 weeks


at Tickeron.com


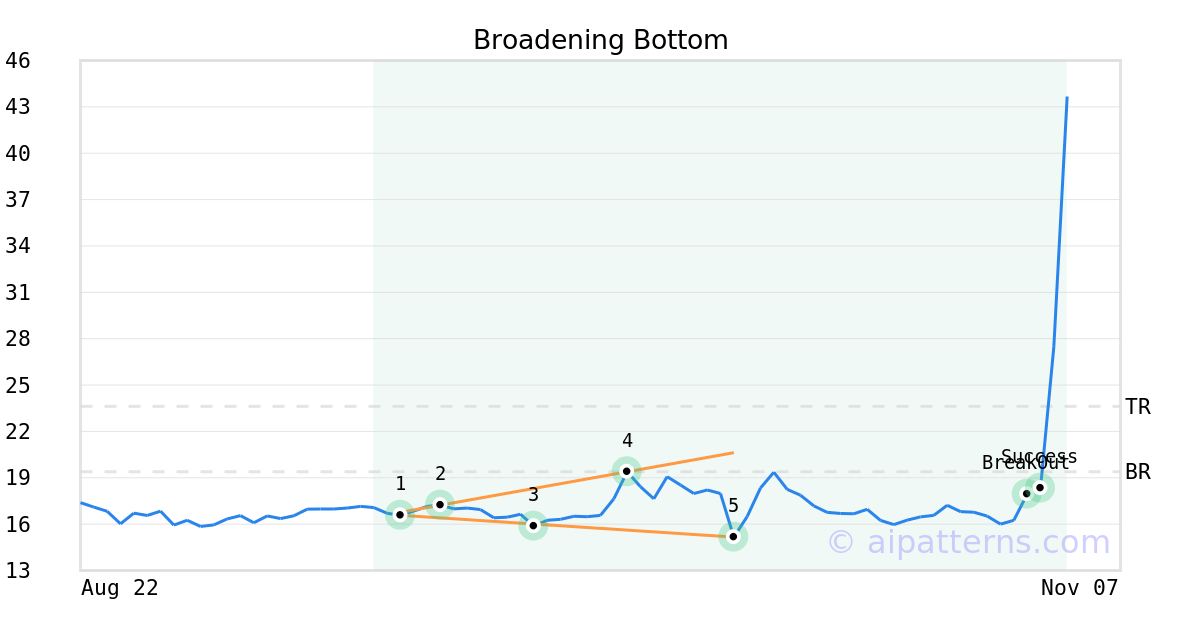
On October 10, 2025, A.I.dvisor detected a Broadening Bottom Pattern (Bullish) for Decred cryptocurrency (DCR.X, $15.279910). On November 01, 2025, A.I.dvisor confirmed the Bullish pattern, setting a target price of $23.620000. 1 day later, on November 02, 2025, DCR.X reached the target price resulting in a +2 for traders who took a long position in the stock.
DCR.X in upward trend: 10-day moving average crossed above 50-day moving average on November 03, 2025
The 10-day moving average for DCR.X crossed bullishly above the 50-day moving average on November 03, 2025. This indicates that the trend has shifted higher and could be considered a buy signal. In of 23 past instances when the 10-day crossed above the 50-day, the stock continued to move higher over the following month. The odds of a continued upward trend are .

Technical Analysis (Indicators)
Bullish Trend Analysis
The Stochastic Oscillator is in the oversold zone. Keep an eye out for a move up in the foreseeable future.
DCR.X moved above its 50-day moving average on November 01, 2025 date and that indicates a change from a downward trend to an upward trend.
Following a +3 3-day Advance, the price is estimated to grow further. Considering data from situations where DCR.X advanced for three days, in of 426 cases, the price rose further within the following month. The odds of a continued upward trend are .
The Aroon Indicator entered an Uptrend today. In of 240 cases where DCR.X Aroon's Indicator entered an Uptrend, the price rose further within the following month. The odds of a continued Uptrend are .
Bearish Trend Analysis
The 10-day RSI Indicator for DCR.X moved out of overbought territory on November 07, 2025. This could be a bearish sign for the stock. Traders may want to consider selling the stock or buying put options. Tickeron's A.I.dvisor looked at 40 similar instances where the indicator moved out of overbought territory. In of the 40 cases, the stock moved lower in the following days. This puts the odds of a move lower at .
The Momentum Indicator moved below the 0 level on November 19, 2025. You may want to consider selling the stock, shorting the stock, or exploring put options on DCR.X as a result. In of 153 cases where the Momentum Indicator fell below 0, the stock fell further within the subsequent month. The odds of a continued downward trend are .
The Moving Average Convergence Divergence Histogram (MACD) for DCR.X turned negative on November 17, 2025. This could be a sign that the stock is set to turn lower in the coming weeks. Traders may want to sell the stock or buy put options. Tickeron's A.I.dvisor looked at 66 similar instances when the indicator turned negative. In of the 66 cases the stock turned lower in the days that followed. This puts the odds of success at .
Following a 3-day decline, the stock is projected to fall further. Considering past instances where DCR.X declined for three days, the price rose further in of 62 cases within the following month. The odds of a continued downward trend are .
DCR.X broke above its upper Bollinger Band on November 01, 2025. This could be a sign that the stock is set to drop as the stock moves back below the upper band and toward the middle band. You may want to consider selling the stock or exploring put options.