DFH Stock Tickeron detected bearish Stock Pattern: Wedge Falling DFH on October 06, 2025, netting in a 15.75% gain over 3 weeks


at Tickeron.com


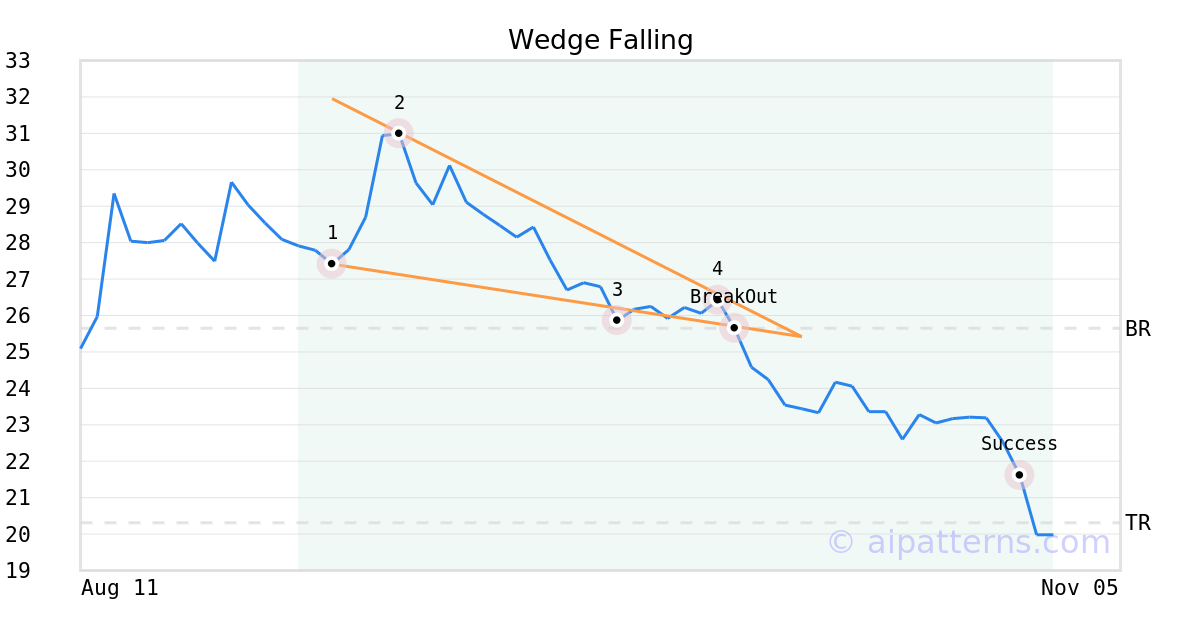
On October 06, 2025, A.I.dvisor detected a Wedge Falling Pattern (Bearish) for Dream Finders Homes (DFH, $25.65). On October 06, 2025, A.I.dvisor confirmed the Bearish pattern, setting a target price of the stock. On October 29, 2025, the stock hit the target price of $20.31 – resulting in a +1 gain for traders who shorted the stock on the pattern detection date.
DFH's Indicator enters downward trend
The Aroon Indicator for DFH entered a downward trend on November 19, 2025. Tickeron's A.I.dvisor identified a pattern where the AroonDown red line was above 70 while the AroonUp green line was below 30 for three straight days. This could indicate a strong downward move is ahead for the stock. Traders may want to consider selling the stock or buying put options. A.I.dvisor looked at 204 similar instances where the Aroon Indicator formed such a pattern. In of the 204 cases the stock moved lower. This puts the odds of a downward move at .

Technical Analysis (Indicators)
Bearish Trend Analysis
The 50-day moving average for DFH moved below the 200-day moving average on November 14, 2025. This could be a long-term bearish signal for the stock as the stock shifts to an downward trend.
Following a 3-day decline, the stock is projected to fall further. Considering past instances where DFH declined for three days, the price rose further in of 62 cases within the following month. The odds of a continued downward trend are .
Bullish Trend Analysis
The RSI Indicator shows that the ticker has stayed in the oversold zone for 4 days. The price of this ticker is presumed to bounce back soon, since the longer the ticker stays in the oversold zone, the more promptly an Uptrend is expected.
The Stochastic Oscillator demonstrated that the ticker has stayed in the oversold zone for 2 days, which means it's wise to expect a price bounce in the near future.
The Moving Average Convergence Divergence (MACD) for DFH just turned positive on November 13, 2025. Looking at past instances where DFH's MACD turned positive, the stock continued to rise in of 45 cases over the following month. The odds of a continued upward trend are .
Following a 3-day Advance, the price is estimated to grow further. Considering data from situations where DFH advanced for three days, in of 311 cases, the price rose further within the following month. The odds of a continued upward trend are .
DFH may jump back above the lower band and head toward the middle band. Traders may consider buying the stock or exploring call options.
Fundamental Analysis (Ratings)
The Tickeron SMR rating for this company is (best 1 - 100 worst), indicating strong sales and a profitable business model. SMR (Sales, Margin, Return on Equity) rating is based on comparative analysis of weighted Sales, Income Margin and Return on Equity values compared against S&P 500 index constituents. The weighted SMR value is a proprietary formula developed by Tickeron and represents an overall profitability measure for a stock.
The Tickeron Valuation Rating of (best 1 - 100 worst) indicates that the company is fair valued in the industry. This rating compares market capitalization estimated by our proprietary formula with the current market capitalization. This rating is based on the following metrics, as compared to industry averages: P/B Ratio (1.200) is normal, around the industry mean (19.756). P/E Ratio (6.257) is within average values for comparable stocks, (54.511). Projected Growth (PEG Ratio) (0.000) is also within normal values, averaging (1.409). DFH has a moderately low Dividend Yield (0.000) as compared to the industry average of (0.038). P/S Ratio (0.385) is also within normal values, averaging (24.801).
The Tickeron PE Growth Rating for this company is (best 1 - 100 worst), pointing to worse than average earnings growth. The PE Growth rating is based on a comparative analysis of stock PE ratio increase over the last 12 months compared against S&P 500 index constituents.
The Tickeron Price Growth Rating for this company is (best 1 - 100 worst), indicating slightly worse than average price growth. DFH’s price grows at a lower rate over the last 12 months as compared to S&P 500 index constituents.
The Tickeron Profit vs. Risk Rating rating for this company is (best 1 - 100 worst), indicating that the returns do not compensate for the risks. DFH’s unstable profits reported over time resulted in significant Drawdowns within these last five years. A stable profit reduces stock drawdown and volatility. The average Profit vs. Risk Rating rating for the industry is 73, placing this stock worse than average.
Advertisement
General Information
Industry Homebuilding