DHC Stock Tickeron detected bullish Stock Pattern: Broadening Top DHC on September 08, 2025, netting in a 11.18% gain over 2 months


at Tickeron.com


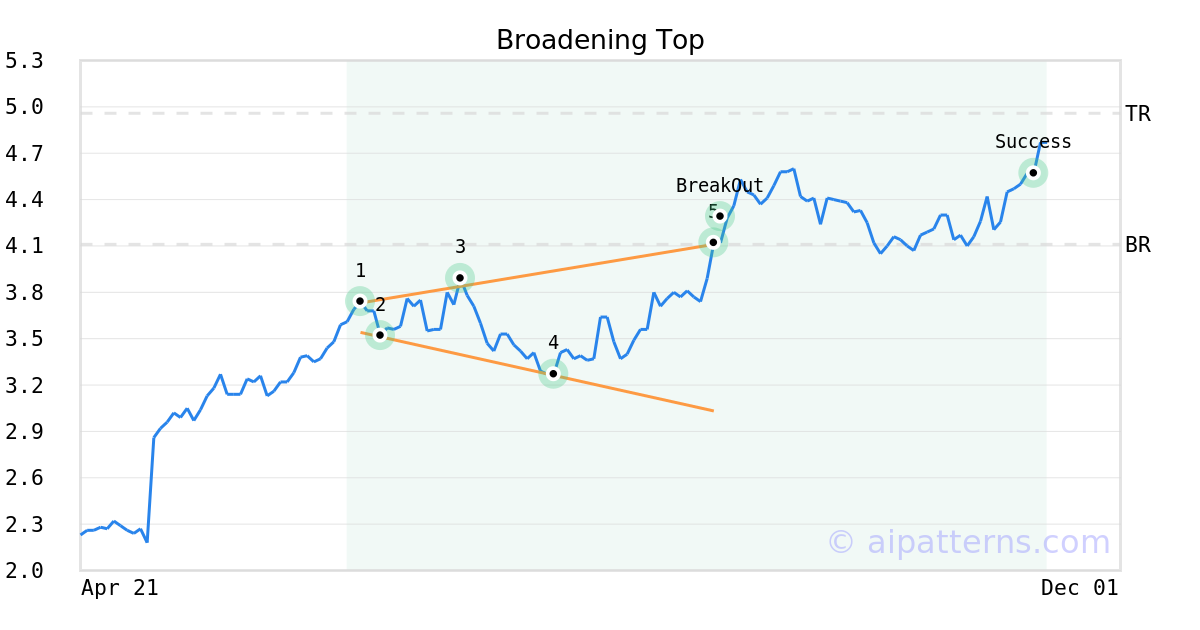
On September 05, 2025, A.I.dvisor detected a Broadening Top Pattern (Bullish) for Diversified Healthcare Trust (DHC, $4.11). On September 08, 2025, A.I.dvisor confirmed the Bullish pattern, setting a target price of $4.96. 65 days later, on November 12, 2025, DHC reached the target price resulting in a +1 for traders who took a long position in the stock.
DHC in +5.41% Uptrend, rising for three consecutive days on November 26, 2025
Moving higher for three straight days is viewed as a bullish sign. Keep an eye on this stock for future growth. Considering data from situations where DHC advanced for three days, in of 260 cases, the price rose further within the following month. The odds of a continued upward trend are .

Technical Analysis (Indicators)
Bullish Trend Analysis
The Momentum Indicator moved above the 0 level on October 30, 2025. You may want to consider a long position or call options on DHC as a result. In of 87 past instances where the momentum indicator moved above 0, the stock continued to climb. The odds of a continued upward trend are .
The Moving Average Convergence Divergence (MACD) for DHC just turned positive on November 03, 2025. Looking at past instances where DHC's MACD turned positive, the stock continued to rise in of 37 cases over the following month. The odds of a continued upward trend are .
DHC moved above its 50-day moving average on November 05, 2025 date and that indicates a change from a downward trend to an upward trend.
The 10-day moving average for DHC crossed bullishly above the 50-day moving average on November 03, 2025. This indicates that the trend has shifted higher and could be considered a buy signal. In of 14 past instances when the 10-day crossed above the 50-day, the stock continued to move higher over the following month. The odds of a continued upward trend are .
Bearish Trend Analysis
The 10-day RSI Indicator for DHC moved out of overbought territory on November 28, 2025. This could be a bearish sign for the stock. Traders may want to consider selling the stock or buying put options. Tickeron's A.I.dvisor looked at 35 similar instances where the indicator moved out of overbought territory. In of the 35 cases, the stock moved lower in the following days. This puts the odds of a move lower at .
The Stochastic Oscillator has been in the overbought zone for 1 day. Expect a price pull-back in the near future.
Following a 3-day decline, the stock is projected to fall further. Considering past instances where DHC declined for three days, the price rose further in of 62 cases within the following month. The odds of a continued downward trend are .
DHC broke above its upper Bollinger Band on November 26, 2025. This could be a sign that the stock is set to drop as the stock moves back below the upper band and toward the middle band. You may want to consider selling the stock or exploring put options.
The Aroon Indicator for DHC entered a downward trend on November 06, 2025. This could indicate a strong downward move is ahead for the stock. Traders may want to consider selling the stock or buying put options.
Fundamental Analysis (Ratings)
The Tickeron Valuation Rating for company is (best 1 - 100 worst), which means the company is slightly undervalued. The valuation of the company is based on a proprietary formula which takes into account a set of fundamentals and gives us an estimate of the price per share for the company. We then compare this estimate with the current price per share. As a result, this company is rated as undervalued in the industry. This rating is based on the following metrics, as compared to industry averages: P/B Ratio (0.694) is normal, around the industry mean (2.166). P/E Ratio (0.000) is within average values for comparable stocks, (69.233). DHC's Projected Growth (PEG Ratio) (0.000) is very low in comparison to the industry average of (3.241). DHC has a moderately low Dividend Yield (0.008) as compared to the industry average of (0.064). DHC's P/S Ratio (0.756) is slightly lower than the industry average of (6.961).
The Tickeron Price Growth Rating for this company is (best 1 - 100 worst), indicating steady price growth. DHC’s price grows at a higher rate over the last 12 months as compared to S&P 500 index constituents.
The Tickeron Seasonality Score of (best 1 - 100 worst) indicates that the company is fair valued in the industry. The Tickeron Seasonality score describes the variance of predictable price changes around the same period every calendar year. These changes can be tied to a specific month, quarter, holiday or vacation period, as well as a meteorological or growing season.
The Tickeron Profit vs. Risk Rating rating for this company is (best 1 - 100 worst), indicating that the returns do not compensate for the risks. DHC’s unstable profits reported over time resulted in significant Drawdowns within these last five years. A stable profit reduces stock drawdown and volatility. The average Profit vs. Risk Rating rating for the industry is 75, placing this stock better than average.
The Tickeron SMR rating for this company is (best 1 - 100 worst), indicating weak sales and an unprofitable business model. SMR (Sales, Margin, Return on Equity) rating is based on comparative analysis of weighted Sales, Income Margin and Return on Equity values compared against S&P 500 index constituents. The weighted SMR value is a proprietary formula developed by Tickeron and represents an overall profitability measure for a stock.
The Tickeron PE Growth Rating for this company is (best 1 - 100 worst), pointing to worse than average earnings growth. The PE Growth rating is based on a comparative analysis of stock PE ratio increase over the last 12 months compared against S&P 500 index constituents.
Advertisement
General Information
a real estate investment trust, which engages in the ownership of senior living communities, medical office buildings, and wellness centers.
Industry ManagedHealthCare