MENU
DNDGX
AS OF
Nov 18 closing price
Price
$21.06
Change
+$0.15 (+0.72%)
Net Assets
84.21M
Intraday BUY SELL Signals
DNDGX Stock Tickeron detected bearish Mutual Fund Pattern: Triangle Descending on June 20, 2024


A.I.dvisor
at Tickeron.com
at Tickeron.com
Buy or Sell
View Daily SignalsLoading...
Triangle Descending
DNDGX - Dunham Small Cap Growth N


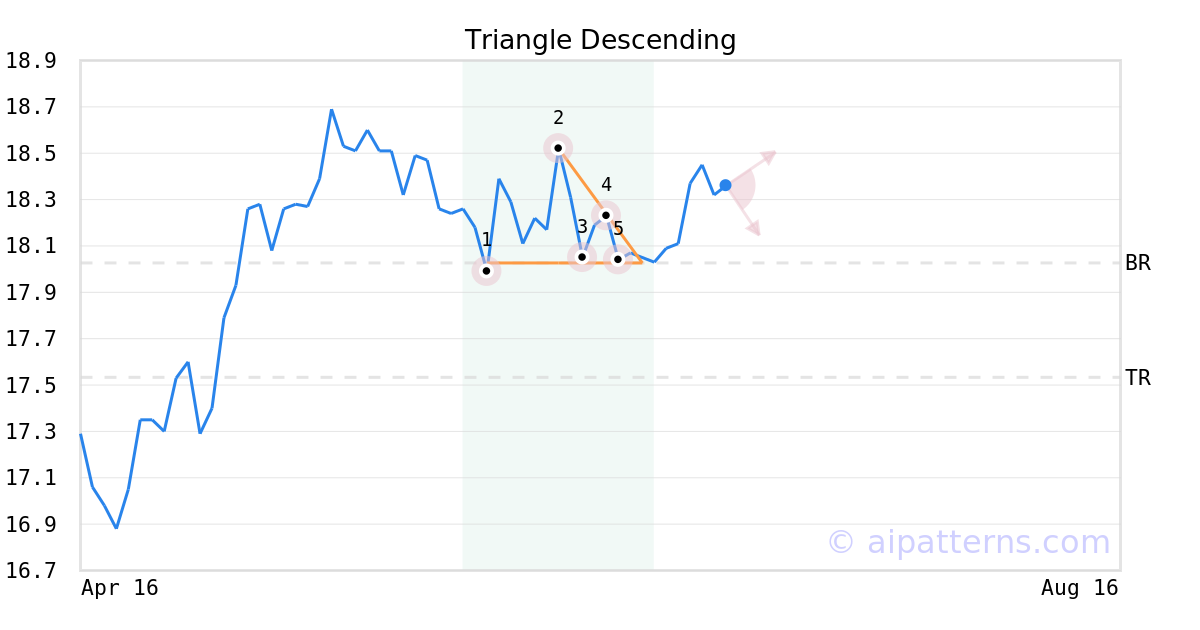
Emerged: 06/20/24
Breakout: $18.03
Price: $18.32
Target price: $17.53
A.I.dvisor detected a bearish Triangle Descending pattern for DNDGX stock. This pattern was detected on June 20, 2024 . The odds of reaching the target price are 6.
The Descending Triangle pattern has a horizontal bottom (1, 3, 5) which represents the support level, and a down-sloping top line (2, 4).
Consider selling the security short or buying a put option at the downward breakout price level. When trading, wait for the confirmation move, which is when the price falls below the breakout level.
View a ticker or compare two or three
VS
VS
Interact to see
Advertisement
Advertisement
A.I.Advisor
published price charts
These past five trading days, the mutual fund lost 0.00%.
A.I. Advisor
published General Information
General Information
Category SmallGrowth
Profile
Fundamentals
Details
Category
Small Growth
Address
Dunham Funds6256 Greenwich Drive, Suite 550San Diego
Phone
800-442-4358
Web
www.dunham.com