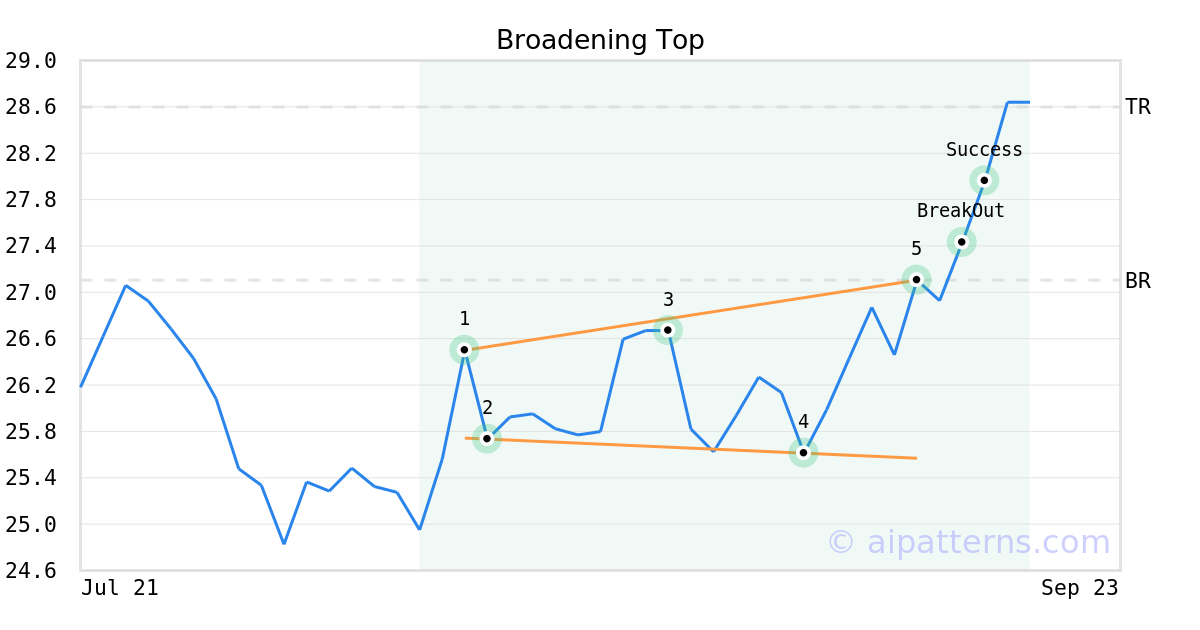
DRAG Stock Tickeron detected bullish ETF Pattern: Broadening Top DRAG on September 15, 2025, netting in a 3.16% gain over 5 days


at Tickeron.com


DRAG's Stochastic Oscillator is remaining in oversold zone for 8 days
The price of this ticker is presumed to bounce back soon, since the longer the ticker stays in the oversold zone, the more promptly an uptrend is expected.

Technical Analysis (Indicators)
Bullish Trend Analysis
The Momentum Indicator moved above the 0 level on October 10, 2025. You may want to consider a long position or call options on DRAG as a result. In of 22 past instances where the momentum indicator moved above 0, the stock continued to climb. The odds of a continued upward trend are .
Following a 3-day Advance, the price is estimated to grow further. Considering data from situations where DRAG advanced for three days, in of 54 cases, the price rose further within the following month. The odds of a continued upward trend are .
The Aroon Indicator entered an Uptrend today. In of 43 cases where DRAG Aroon's Indicator entered an Uptrend, the price rose further within the following month. The odds of a continued Uptrend are .
Bearish Trend Analysis
The 10-day RSI Indicator for DRAG moved out of overbought territory on September 18, 2025. This could be a bearish sign for the stock. Traders may want to consider selling the stock or buying put options. Tickeron's A.I.dvisor looked at 6 similar instances where the indicator moved out of overbought territory. In of the 6 cases, the stock moved lower in the following days. This puts the odds of a move lower at .
The Moving Average Convergence Divergence Histogram (MACD) for DRAG turned negative on October 06, 2025. This could be a sign that the stock is set to turn lower in the coming weeks. Traders may want to sell the stock or buy put options. Tickeron's A.I.dvisor looked at 10 similar instances when the indicator turned negative. In of the 10 cases the stock turned lower in the days that followed. This puts the odds of success at .


Advertisement