DSFGY Stock Dah Sing Financial Holdings (DSFGY) is expected to pay dividends on October 03, 2025


at Tickeron.com
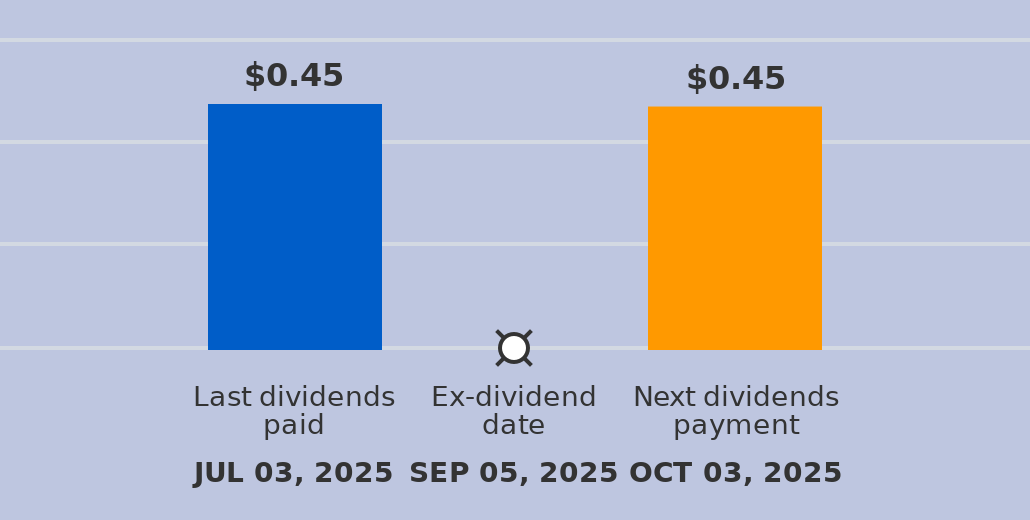
A dividend of $0.45 per share will be paid with a record date of October 03, 2025, and an ex-dividend date of September 05, 2025. The last dividend of $0.45 was paid on July 03, 2025. The ex-dividend date is usually set several business days before the record date. If a stock is purchased on its ex-dividend date or after, the next dividend payment will not be received. Instead, the dividends are repossessed by to the seller. If the stocks are purchased before the ex-dividend date, the buyer will receive the dividends.
DSFGY's MACD Histogram crosses above signal line
The Moving Average Convergence Divergence (MACD) for DSFGY turned positive on October 31, 2025. Looking at past instances where DSFGY's MACD turned positive, the stock continued to rise in of 50 cases over the following month. The odds of a continued upward trend are .

Technical Analysis (Indicators)
Bullish Trend Analysis
DSFGY moved above its 50-day moving average on November 17, 2025 date and that indicates a change from a downward trend to an upward trend.
The 10-day moving average for DSFGY crossed bullishly above the 50-day moving average on November 17, 2025. This indicates that the trend has shifted higher and could be considered a buy signal. In of 17 past instances when the 10-day crossed above the 50-day, the stock continued to move higher over the following month. The odds of a continued upward trend are .
Bearish Trend Analysis
The RSI Indicator demonstrates that the ticker has stayed in the overbought zone for 7 days. The longer the ticker stays in the overbought zone, the sooner a price pull-back is expected.
The Aroon Indicator for DSFGY entered a downward trend on October 30, 2025. This could indicate a strong downward move is ahead for the stock. Traders may want to consider selling the stock or buying put options.
Fundamental Analysis (Ratings)
The Tickeron SMR rating for this company is (best 1 - 100 worst), indicating very strong sales and a profitable business model. SMR (Sales, Margin, Return on Equity) rating is based on comparative analysis of weighted Sales, Income Margin and Return on Equity values compared against S&P 500 index constituents. The weighted SMR value is a proprietary formula developed by Tickeron and represents an overall profitability measure for a stock.
The Tickeron Valuation Rating of (best 1 - 100 worst) indicates that the company is seriously undervalued in the industry. This rating compares market capitalization estimated by our proprietary formula with the current market capitalization. This rating is based on the following metrics, as compared to industry averages: DSFGY's P/B Ratio (0.340) is slightly lower than the industry average of (1.126). P/E Ratio (7.316) is within average values for comparable stocks, (18.237). Projected Growth (PEG Ratio) (0.000) is also within normal values, averaging (3.234). DSFGY has a moderately high Dividend Yield (0.060) as compared to the industry average of (0.036). P/S Ratio (1.586) is also within normal values, averaging (5.222).
The Tickeron Profit vs. Risk Rating rating for this company is (best 1 - 100 worst), indicating low risk on high returns. The average Profit vs. Risk Rating rating for the industry is 51, placing this stock better than average.
The Tickeron PE Growth Rating for this company is (best 1 - 100 worst), pointing to outstanding earnings growth. The PE Growth rating is based on a comparative analysis of stock PE ratio increase over the last 12 months compared against S&P 500 index constituents.
The Tickeron Price Growth Rating for this company is (best 1 - 100 worst), indicating steady price growth. DSFGY’s price grows at a higher rate over the last 12 months as compared to S&P 500 index constituents.
Advertisement
General Information
Industry RegionalBanks