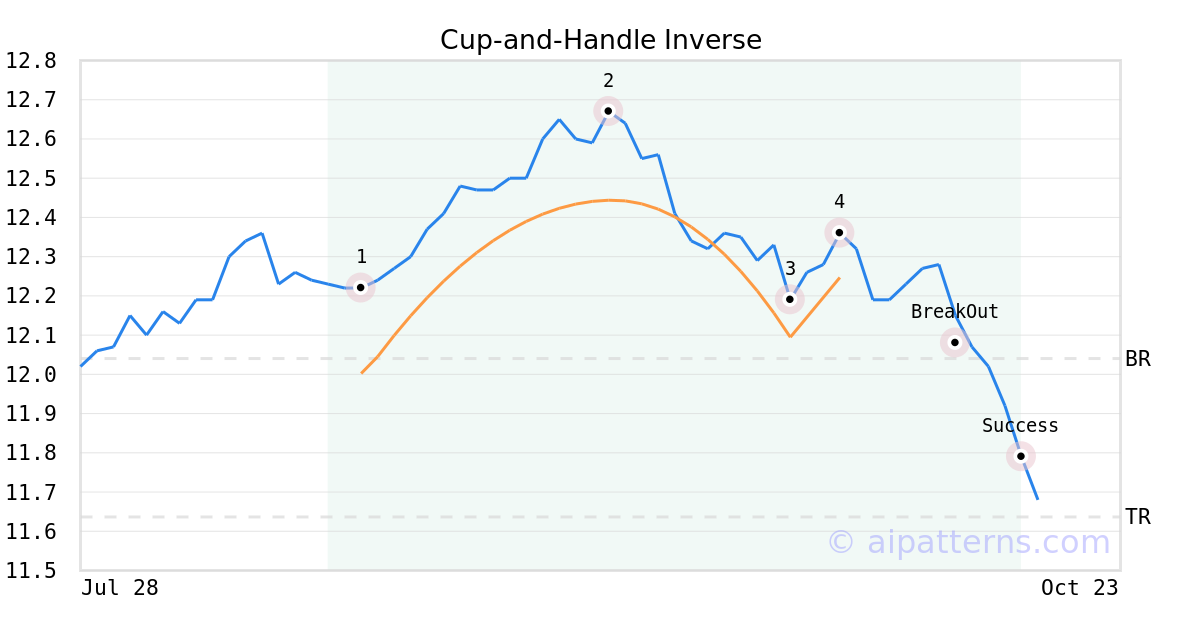
DSL Stock Tickeron detected bearish ETF Pattern: Cup-and-Handle Inverse DSL on October 10, 2025, netting in a 3.73% gain over 2 weeks


at Tickeron.com


DSL's Indicator enters downward trend
The Aroon Indicator for DSL entered a downward trend on October 24, 2025. Tickeron's A.I.dvisor identified a pattern where the AroonDown red line was above 70 while the AroonUp green line was below 30 for three straight days. This could indicate a strong downward move is ahead for the stock. Traders may want to consider selling the stock or buying put options. A.I.dvisor looked at 138 similar instances where the Aroon Indicator formed such a pattern. In of the 138 cases the stock moved lower. This puts the odds of a downward move at .

Technical Analysis (Indicators)
Bearish Trend Analysis
The Momentum Indicator moved below the 0 level on October 06, 2025. You may want to consider selling the stock, shorting the stock, or exploring put options on DSL as a result. In of 81 cases where the Momentum Indicator fell below 0, the stock fell further within the subsequent month. The odds of a continued downward trend are .
DSL moved below its 50-day moving average on October 10, 2025 date and that indicates a change from an upward trend to a downward trend.
The 10-day moving average for DSL crossed bearishly below the 50-day moving average on October 13, 2025. This indicates that the trend has shifted lower and could be considered a sell signal. In of 12 past instances when the 10-day crossed below the 50-day, the stock continued to move higher over the following month. The odds of a continued downward trend are .
Following a 3-day decline, the stock is projected to fall further. Considering past instances where DSL declined for three days, the price rose further in of 62 cases within the following month. The odds of a continued downward trend are .
Bullish Trend Analysis
The RSI Indicator points to a transition from a downward trend to an upward trend -- in cases where DSL's RSI Indicator exited the oversold zone, of 29 resulted in an increase in price. Tickeron's analysis proposes that the odds of a continued upward trend are .
The Stochastic Oscillator suggests the stock price trend may be in a reversal from a downward trend to an upward trend. of 46 cases where DSL's Stochastic Oscillator exited the oversold zone resulted in an increase in price. Tickeron's analysis proposes that the odds of a continued upward trend are .
Following a 3-day Advance, the price is estimated to grow further. Considering data from situations where DSL advanced for three days, in of 281 cases, the price rose further within the following month. The odds of a continued upward trend are .
DSL may jump back above the lower band and head toward the middle band. Traders may consider buying the stock or exploring call options.


Advertisement
General Information
Category Unknown