DUK Stock Tickeron detected bullish Stock Pattern: Triangle Descending on November 24, 2025


at Tickeron.com


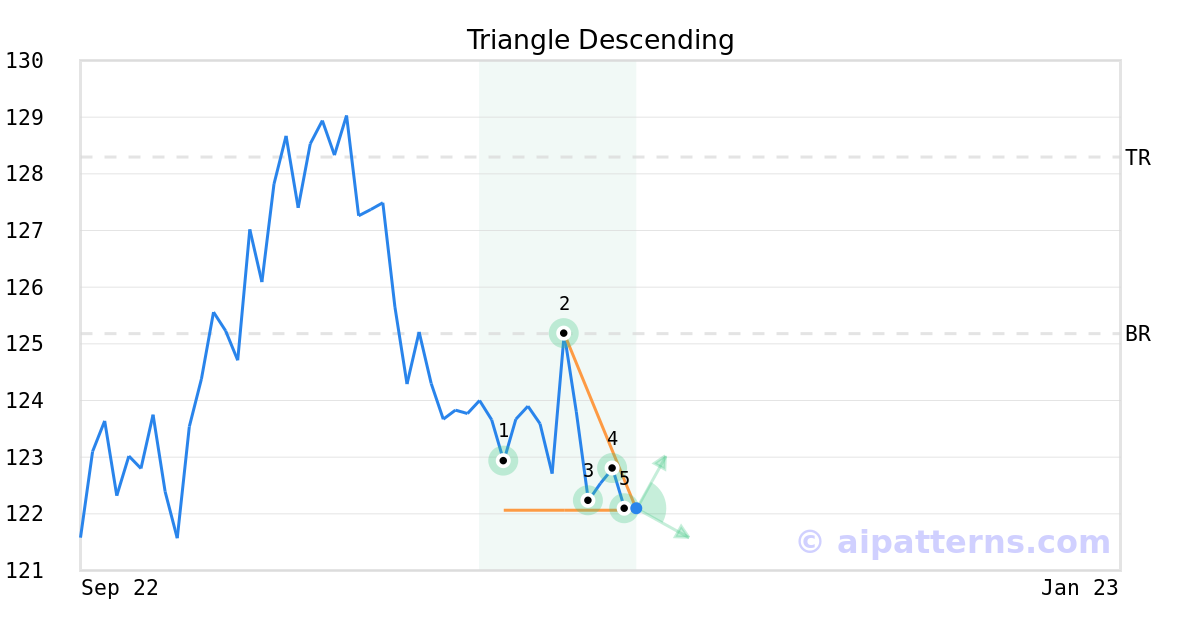
A.I.dvisor detected a bullish Triangle Descending pattern for DUK stock. This pattern was detected on November 24, 2025 . The odds of reaching the target price are 6.
The Descending Triangle pattern is formed when the price of a security establishes a support level (1, 3, 5) and bounces off that level to a declining resistance level, creating a down-sloping top line (2, 4).
Consider buying a security or call option at the breakout price level. When trading, wait for the confirmation move, which is when the price rises above the breakout level.
DUK sees its Stochastic Oscillator ascends from oversold territory
On November 28, 2025, the Stochastic Oscillator for DUK moved out of oversold territory and this could be a bullish sign for the stock. Traders may want to buy the stock or buy call options. Tickeron's A.I.dvisor looked at 53 instances where the indicator left the oversold zone. In of the 53 cases the stock moved higher in the following days. This puts the odds of a move higher at over .

Technical Analysis (Indicators)
Bullish Trend Analysis
Following a 3-day Advance, the price is estimated to grow further. Considering data from situations where DUK advanced for three days, in of 342 cases, the price rose further within the following month. The odds of a continued upward trend are .
DUK may jump back above the lower band and head toward the middle band. Traders may consider buying the stock or exploring call options.
Bearish Trend Analysis
The Momentum Indicator moved below the 0 level on December 01, 2025. You may want to consider selling the stock, shorting the stock, or exploring put options on DUK as a result. In of 95 cases where the Momentum Indicator fell below 0, the stock fell further within the subsequent month. The odds of a continued downward trend are .
The Moving Average Convergence Divergence Histogram (MACD) for DUK turned negative on December 01, 2025. This could be a sign that the stock is set to turn lower in the coming weeks. Traders may want to sell the stock or buy put options. Tickeron's A.I.dvisor looked at 46 similar instances when the indicator turned negative. In of the 46 cases the stock turned lower in the days that followed. This puts the odds of success at .
DUK moved below its 50-day moving average on December 01, 2025 date and that indicates a change from an upward trend to a downward trend.
The 10-day moving average for DUK crossed bearishly below the 50-day moving average on November 11, 2025. This indicates that the trend has shifted lower and could be considered a sell signal. In of 20 past instances when the 10-day crossed below the 50-day, the stock continued to move higher over the following month. The odds of a continued downward trend are .
Following a 3-day decline, the stock is projected to fall further. Considering past instances where DUK declined for three days, the price rose further in of 62 cases within the following month. The odds of a continued downward trend are .
The Aroon Indicator for DUK entered a downward trend on November 19, 2025. This could indicate a strong downward move is ahead for the stock. Traders may want to consider selling the stock or buying put options.
Fundamental Analysis (Ratings)
The Tickeron Profit vs. Risk Rating rating for this company is (best 1 - 100 worst), indicating low risk on high returns. The average Profit vs. Risk Rating rating for the industry is 70, placing this stock better than average.
The Tickeron Price Growth Rating for this company is (best 1 - 100 worst), indicating steady price growth. DUK’s price grows at a higher rate over the last 12 months as compared to S&P 500 index constituents.
The Tickeron PE Growth Rating for this company is (best 1 - 100 worst), pointing to consistent earnings growth. The PE Growth rating is based on a comparative analysis of stock PE ratio increase over the last 12 months compared against S&P 500 index constituents.
The Tickeron Valuation Rating of (best 1 - 100 worst) indicates that the company is fair valued in the industry. This rating compares market capitalization estimated by our proprietary formula with the current market capitalization. This rating is based on the following metrics, as compared to industry averages: P/B Ratio (1.844) is normal, around the industry mean (140.614). P/E Ratio (18.849) is within average values for comparable stocks, (18.581). Projected Growth (PEG Ratio) (2.492) is also within normal values, averaging (4.181). Dividend Yield (0.035) settles around the average of (0.048) among similar stocks. P/S Ratio (2.933) is also within normal values, averaging (3.143).
The Tickeron SMR rating for this company is (best 1 - 100 worst), indicating weak sales and an unprofitable business model. SMR (Sales, Margin, Return on Equity) rating is based on comparative analysis of weighted Sales, Income Margin and Return on Equity values compared against S&P 500 index constituents. The weighted SMR value is a proprietary formula developed by Tickeron and represents an overall profitability measure for a stock.
Advertisement
General Information
a company which engages in electric power and gas distribution operations and other energy services
Industry ElectricUtilities