DVYE Stock Tickeron detected bullish ETF Pattern: Three Rising Valleys DVYE on October 22, 2025, netting in a 7.56% gain over 1 month


at Tickeron.com


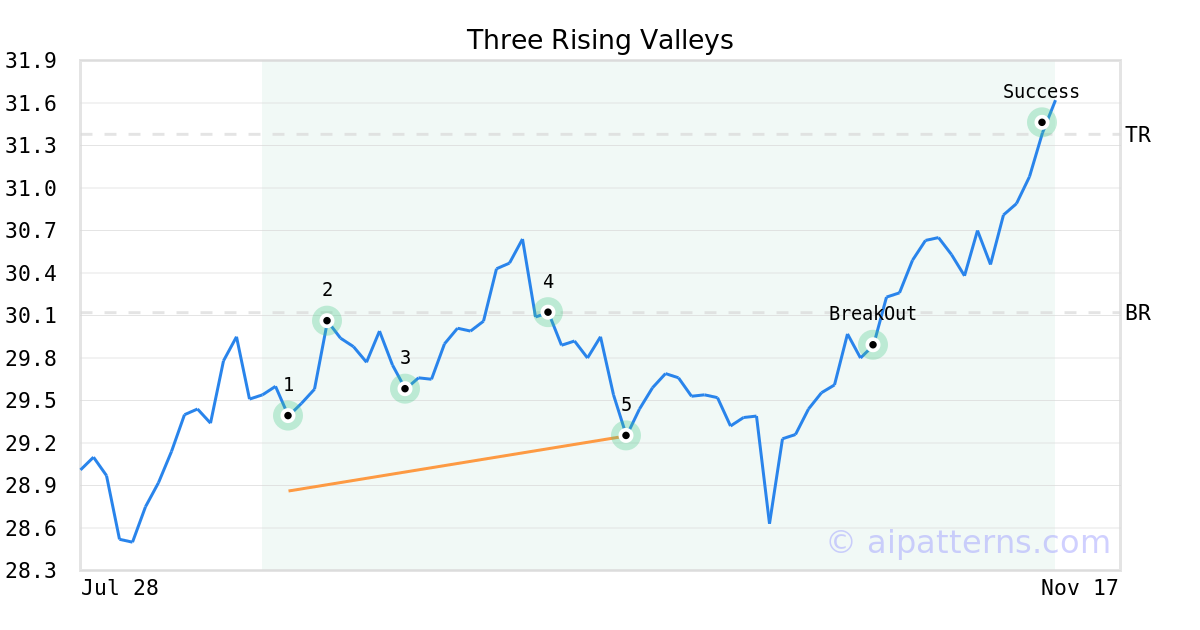
On September 25, 2025, A.I.dvisor detected a Three Rising Valleys Pattern (Bullish) for iShares Emerging Markets Dividend ETF (DVYE, $29.25). On October 22, 2025, A.I.dvisor confirmed the Bullish pattern, setting a target price of $31.38. 19 days later, on November 10, 2025, DVYE reached the target price resulting in a for traders who took a long position in the stock.
DVYE sees its Stochastic Oscillator ascends from oversold territory
On November 26, 2025, the Stochastic Oscillator for DVYE moved out of oversold territory and this could be a bullish sign for the stock. Traders may want to buy the stock or buy call options. Tickeron's A.I.dvisor looked at 53 instances where the indicator left the oversold zone. In of the 53 cases the stock moved higher in the following days. This puts the odds of a move higher at over .

Technical Analysis (Indicators)
Bullish Trend Analysis
Following a 3-day Advance, the price is estimated to grow further. Considering data from situations where DVYE advanced for three days, in of 332 cases, the price rose further within the following month. The odds of a continued upward trend are .
The Aroon Indicator entered an Uptrend today. In of 278 cases where DVYE Aroon's Indicator entered an Uptrend, the price rose further within the following month. The odds of a continued Uptrend are .
Bearish Trend Analysis
The 10-day RSI Indicator for DVYE moved out of overbought territory on November 17, 2025. This could be a bearish sign for the stock. Traders may want to consider selling the stock or buying put options. Tickeron's A.I.dvisor looked at 42 similar instances where the indicator moved out of overbought territory. In of the 42 cases, the stock moved lower in the following days. This puts the odds of a move lower at .
The Momentum Indicator moved below the 0 level on November 20, 2025. You may want to consider selling the stock, shorting the stock, or exploring put options on DVYE as a result. In of 87 cases where the Momentum Indicator fell below 0, the stock fell further within the subsequent month. The odds of a continued downward trend are .
The Moving Average Convergence Divergence Histogram (MACD) for DVYE turned negative on November 18, 2025. This could be a sign that the stock is set to turn lower in the coming weeks. Traders may want to sell the stock or buy put options. Tickeron's A.I.dvisor looked at 47 similar instances when the indicator turned negative. In of the 47 cases the stock turned lower in the days that followed. This puts the odds of success at .
Following a 3-day decline, the stock is projected to fall further. Considering past instances where DVYE declined for three days, the price rose further in of 62 cases within the following month. The odds of a continued downward trend are .
DVYE broke above its upper Bollinger Band on November 10, 2025. This could be a sign that the stock is set to drop as the stock moves back below the upper band and toward the middle band. You may want to consider selling the stock or exploring put options.
Advertisement
General Information
Category DiversifiedEmergingMkts