DWLD Stock Tickeron detected bullish ETF Pattern: Broadening Bottom on November 18, 2025


at Tickeron.com


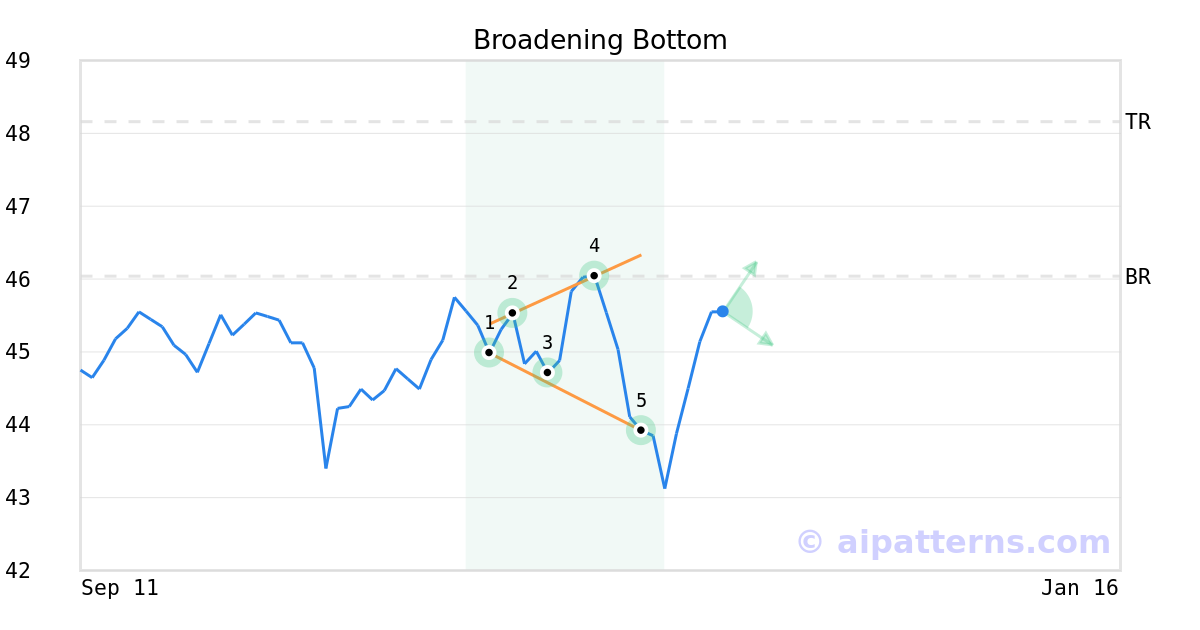
A.I.dvisor detected a bullish Broadening Bottom pattern for DWLD stock. This pattern was detected on November 18, 2025 . The odds of reaching the target price are 6.
The Broadening Bottom pattern is formed when the price of a security progressively makes higher highs (2, 4) and lower lows (1, 3, 5) following two widening trend lines.
Consider buying a security or call option at the upward breakout price/entry point.
DWLD in downward trend: 10-day moving average moved below 50-day moving average on November 19, 2025
The 10-day moving average for DWLD crossed bearishly below the 50-day moving average on November 19, 2025. This indicates that the trend has shifted lower and could be considered a sell signal. In of 12 past instances when the 10-day crossed below the 50-day, the stock continued to move higher over the following month. The odds of a continued downward trend are .

Technical Analysis (Indicators)
Bearish Trend Analysis
The Stochastic Oscillator entered the overbought zone. Expect a price pull-back in the foreseeable future.
Following a 3-day decline, the stock is projected to fall further. Considering past instances where DWLD declined for three days, the price rose further in of 62 cases within the following month. The odds of a continued downward trend are .
Bullish Trend Analysis
The RSI Indicator points to a transition from a downward trend to an upward trend -- in cases where DWLD's RSI Oscillator exited the oversold zone, of 30 resulted in an increase in price. Tickeron's analysis proposes that the odds of a continued upward trend are .
The Momentum Indicator moved above the 0 level on November 28, 2025. You may want to consider a long position or call options on DWLD as a result. In of 89 past instances where the momentum indicator moved above 0, the stock continued to climb. The odds of a continued upward trend are .
The Moving Average Convergence Divergence (MACD) for DWLD just turned positive on November 26, 2025. Looking at past instances where DWLD's MACD turned positive, the stock continued to rise in of 49 cases over the following month. The odds of a continued upward trend are .
DWLD moved above its 50-day moving average on November 25, 2025 date and that indicates a change from a downward trend to an upward trend.
Following a 3-day Advance, the price is estimated to grow further. Considering data from situations where DWLD advanced for three days, in of 337 cases, the price rose further within the following month. The odds of a continued upward trend are .
DWLD may jump back above the lower band and head toward the middle band. Traders may consider buying the stock or exploring call options.
The Aroon Indicator entered an Uptrend today. In of 269 cases where DWLD Aroon's Indicator entered an Uptrend, the price rose further within the following month. The odds of a continued Uptrend are .
Advertisement
General Information
Category ForeignLargeBlend