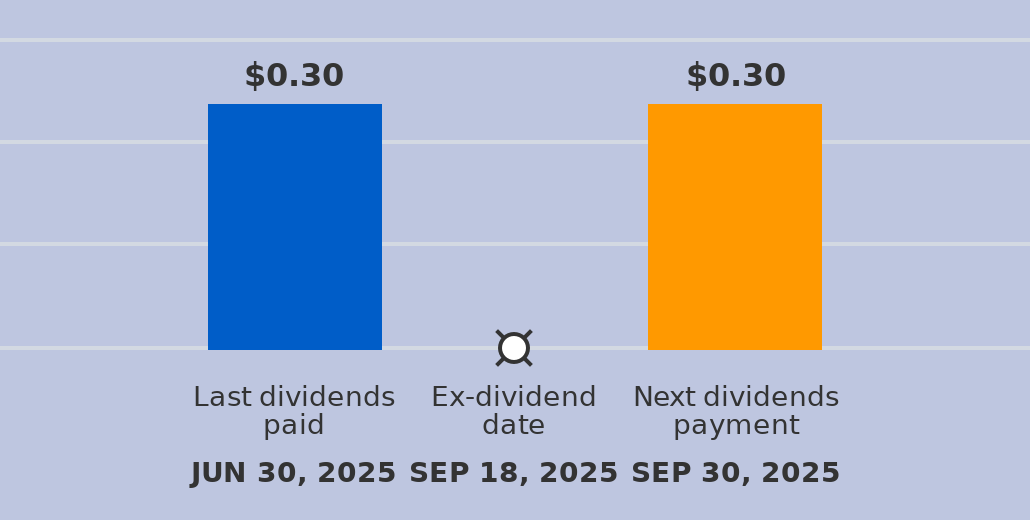
EERGF Stock ENERGEAN OIL AND GAS (EERGF) is expected to pay dividends on September 30, 2025


at Tickeron.com
EERGF in upward trend: price may jump up because it broke its lower Bollinger Band on September 29, 2025
EERGF may jump back above the lower band and head toward the middle band. Traders may consider buying the stock or exploring call options. In of 23 cases where EERGF's price broke its lower Bollinger Band, its price rose further in the following month. The odds of a continued upward trend are .

Technical Analysis (Indicators)
Bullish Trend Analysis
The RSI Indicator shows that the ticker has stayed in the oversold zone for 22 days. The price of this ticker is presumed to bounce back soon, since the longer the ticker stays in the oversold zone, the more promptly an Uptrend is expected.
Bearish Trend Analysis
The Momentum Indicator moved below the 0 level on September 02, 2025. You may want to consider selling the stock, shorting the stock, or exploring put options on EERGF as a result. In of 39 cases where the Momentum Indicator fell below 0, the stock fell further within the subsequent month. The odds of a continued downward trend are .
EERGF moved below its 50-day moving average on September 02, 2025 date and that indicates a change from an upward trend to a downward trend.
The 10-day moving average for EERGF crossed bearishly below the 50-day moving average on September 04, 2025. This indicates that the trend has shifted lower and could be considered a sell signal. In of 15 past instances when the 10-day crossed below the 50-day, the stock continued to move higher over the following month. The odds of a continued downward trend are .
The Aroon Indicator for EERGF entered a downward trend on October 03, 2025. This could indicate a strong downward move is ahead for the stock. Traders may want to consider selling the stock or buying put options.
Fundamental Analysis (Ratings)
The Tickeron PE Growth Rating for this company is (best 1 - 100 worst), pointing to outstanding earnings growth. The PE Growth rating is based on a comparative analysis of stock PE ratio increase over the last 12 months compared against S&P 500 index constituents.
The Tickeron Valuation Rating of (best 1 - 100 worst) indicates that the company is slightly undervalued in the industry. This rating compares market capitalization estimated by our proprietary formula with the current market capitalization. This rating is based on the following metrics, as compared to industry averages: P/B Ratio (3.036) is normal, around the industry mean (7.877). P/E Ratio (14.509) is within average values for comparable stocks, (23.383). Projected Growth (PEG Ratio) (0.000) is also within normal values, averaging (3.677). Dividend Yield (0.113) settles around the average of (0.070) among similar stocks. P/S Ratio (1.589) is also within normal values, averaging (90.183).
The Tickeron Profit vs. Risk Rating rating for this company is (best 1 - 100 worst), indicating well-balanced risk and returns. The average Profit vs. Risk Rating rating for the industry is 73, placing this stock slightly better than average.
The Tickeron Seasonality Score of (best 1 - 100 worst) indicates that the company is fair valued in the industry. The Tickeron Seasonality score describes the variance of predictable price changes around the same period every calendar year. These changes can be tied to a specific month, quarter, holiday or vacation period, as well as a meteorological or growing season.
The Tickeron Price Growth Rating for this company is (best 1 - 100 worst), indicating fairly steady price growth. EERGF’s price grows at a lower rate over the last 12 months as compared to S&P 500 index constituents.
The Tickeron SMR rating for this company is (best 1 - 100 worst), indicating weak sales and an unprofitable business model. SMR (Sales, Margin, Return on Equity) rating is based on comparative analysis of weighted Sales, Income Margin and Return on Equity values compared against S&P 500 index constituents. The weighted SMR value is a proprietary formula developed by Tickeron and represents an overall profitability measure for a stock.


Advertisement
General Information
Industry OilGasProduction